Version v0.4.5 has been released and brings new support for a variety of new image and map data formats in addition to some other smaller bug fixes.
With the recent plugin system it’s become easier to add new extended functionality such as loading other tiled data formats. Specifically support for Microsoft’s Deep Zoom Image format, the conventional XYZ map tiles format (used by OpenStreetMap, Google Maps, etc), and initial limited support for TMS tiles. More to come!
I’m trying to display our data in your viewer and while there are quite a few generators which convert objects to 3d tiles, I’m struggling to integrate terrain data (like your mars dataset). What converter / pipeline did you use to generate these 3D-tiles? Any plans on reading quantized mesh terrain data?
What converter / pipeline did you use to generate these 3D-tiles?
The pipeline used is internal to JPL and not easily run on non-Martian data. See this resources list linked in the README for more information on generators, etc.
Any plans on reading quantized mesh terrain data?
Support for this should be available in the coming months.
It’s been a little while and a few releases since the last post but thanks to another Cesium Ecosystem Grant there are some big new features available with in 3d-tiles-renderer. You can read through the full set of patch notes from the last releases here but here are some of the big new additions in the last few releases up to v0.4.13.
Topographic Lines Demo
“Topographic Lines” or “Contour Lines” can help give a sense for the change in height of a surface, particularly when lighting is limited, without obscuring the underlying imagery too significantly. The topographic lines material added to the project supports level-of-detail scaling on zoom and works with Ellipsoid tile sets like Google Photorealistic Tiles.
Development screenshot showing the topographic lines on sample Mars data. Demo here (select "displayTopoLines")
Demonstration of topographic and cartographic lines working with Google Photorealistic Lines. Demo here (select "displayTopoLines")
Quantized Mesh Support
Quantized Mesh is precursor to 3d tiles by Cesium that stores altitude data in a quad-tree-like format designed for displaying cartographic data. The “QuantizedMeshPlugin” has been added to the 3d-tiles-renderer project to support loading and displaying quantized mesh data.
Another feature inspired by Cesium and other geospatial applications is the ability to overlay multiple tiled texture data sets on top of 3d tiles in a planar or cartographic projection.
Demonstration of TMS-tiled OpenStreetMap data overlaid on top of the Swiss Terrain data set.
Demonstration of TMS tiled data overlaid on top of the sample 3d tiles data set (excuse the lack of good demo data 😅).
Demonstration of two TMS data sets overlaid on top of quantized mesh terrain loaded from Cesium Ion showing layer-independent color and opacity adjustment. Demo here.
These bring quite a few new possibilities to geospatial rendering with the project and will be compatible as new tiled data formats become supported! Another big thanks to Cesium for supporting the project!
Another release, another new set of data formats supported in the tiles renderer! The latest v0.4.17 release adds support for the WMTS tiled image format and WMS mapping service - both usable as overlays and image tiles. Development and features are still in-progress but a plugin has also been added for GeoJSON overlays. With the new release the project now supports eight tiled geometry and image data formats:
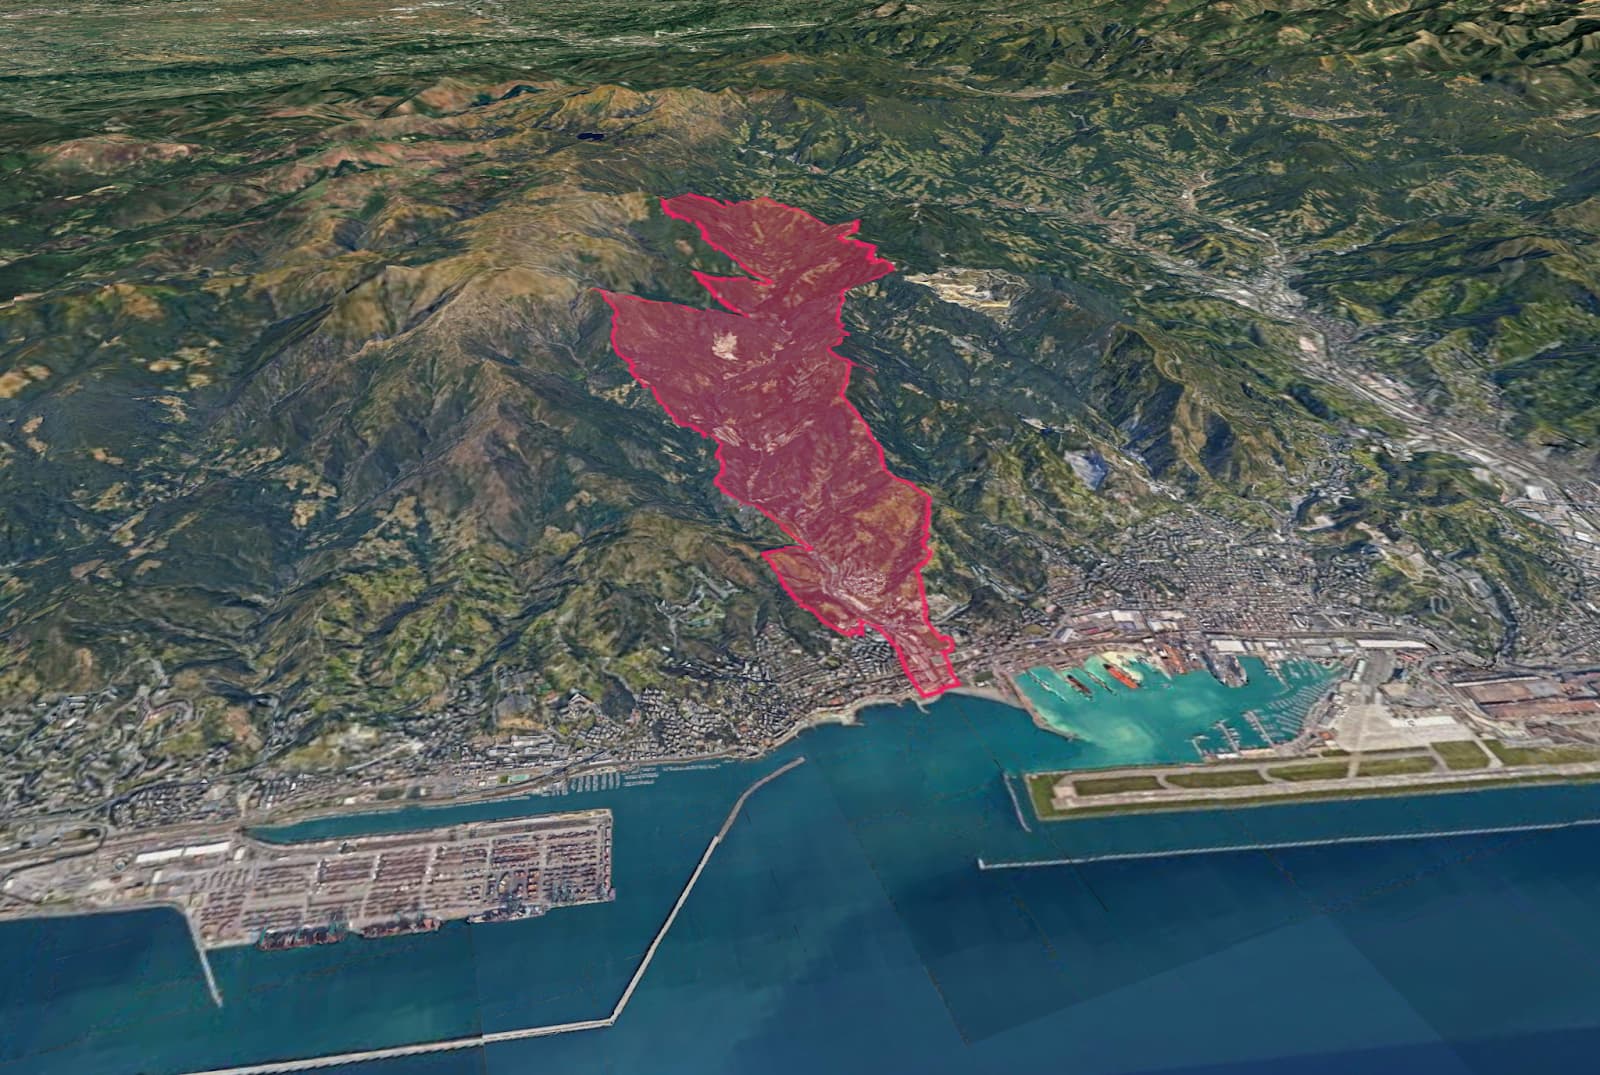
GeoJSON shape overlaid on Val Varenna, Italy using an in-progress GeoJSON overlay plugin. Demo here.
And a small milestone - the project usage has more than doubled since the beginning of the year and is now at well over 7,000 downloads per week! Thanks to everyone who have been using the library and sharing your work!
Version 0.4.19 has been released! This version has primarily been some refactoring and small quality of life improvements but one new feature addition is the ability to clip geometry using the “ImageOverlayPlugin” to alpha mask regions. This kind of masking can be used to cut out shapes to fit drone photogrammetry & architectural assets on the globe or stylistically clipped to highlight a landmark:
3DTilesRendererJS version 0.4.25 it now out! This release brings some great, less visible features like a new “loadAncestors” flag to jump straight to loading the high LoD tiles while skipping loading parent tiles, saving memory and download bandwidth - all thanks to a new tiles traversal logic.
A fairly significant addition is that the project now supports Babylon.js! The implementation shares the same base classes and is exported from the project, enabling improvements from both communities to benefit everyone.
Onto some new data format support for the three.js renderer:
Gaussian Splats
Thanks to a great community plugin, Gaussian Splats tile sets can now be rendered with the TilesRenderer, based on the SparkJS GS library! You can find this and more community resources and plugins in the newly added sections.
Gaussian Splats 3D Tiles data set being rendered with 3DTilesRendererJS
Mapbox Vector Tiles
The project has also taken the first step towards implementing “Vector Tiles” formats - like those supported by Mapbox and MapLibre. These formats specify data as a series of vector shapes with embedded metadata rather than pre-rasterized images. This lets you zoom in indefinitely and specify the colors of your image overlays to fit the needs of your application. More vector tiles features to come!
MVT tile overlays rendered with custom color palettes in 3DTilesRendererJS
Project Growth
A final small aside, but it’s been great to see the project gain some new momentum over the last year, growing in downloads per week by almost 5x (!!). The project started almost exactly 6 years ago today so it’s great to see it gaining more traction. Please share your work if you’re building anything with it!