Is there a good way to test shader performance? Is there any way to find out how long a frame takes?
(I am considering using an if statement or two in a fragment shader and it would helpful to know the cost)
I guess there is MS box on stats: stats.js | JavaScript Performance Monitor
I’m wondering if there is anything more specific to vertex and fragment shader render time/performance.
I guess there is MS box on stats: stats.js | JavaScript Performance Monitor
This just measures JS performance and won’t be great for measuring the impact of shader changes.
See this PR which adds a panel for stat.js which measures the amount of time the GPU spends doing work. It uses the disjoint_timer_query extension , which seems to only be available in chrome, and provides timings in nanoseconds (while the panel in the PR displays timings in MS):
mrdoob:dev ← gkjohnson:gpu-stats-panel
opened 01:48AM - 25 Mar 21 UTC
Related issue: --
**Description**
Inspired by @brunosimon's tweet [here](h… ttps://twitter.com/bruno_simon/status/1370338446150094854) this PR adds a custom GPU stats panel for tracking time spent doing GPU work when rendering using [disjoint_timer_query](https://www.khronos.org/registry/webgl/extensions/EXT_disjoint_timer_query_webgl2/) for WebGL1 and 2. The MDN docs on the extension are out of date / non existent but the khronos spec document has a pretty easy to follow example. This can ultimately be used to optimize materials and check the impact of shader changes. A timing query is not guaranteed to be available on the next frame so the panel iteratively checks whether a query is complete on subsequent frames by starting a chain of requestAnimationFrame callbacks to check it. This ensures that no frame measurement is missed and that the panel works with the on demand rendering use case.
You can use it like so:
```js
import Stats from 'three/examples/jsm/libs/stats.module.js';
import { GPUStatsPanel } from 'three/examples/jsm/utils/GPUStatsPanel.js';
// ... init
stats = new Stats();
document.body.appendChild( stats.domElement );
gpuPanel = new GPUStatsPanel();
stats.addPanel( gpuPanel );
stats.showPanel( 0 );
// ... render
stats.update();
gpuPanel.startQuery();
renderer.render( camera, scene );
gpuPanel.endQuery();
```
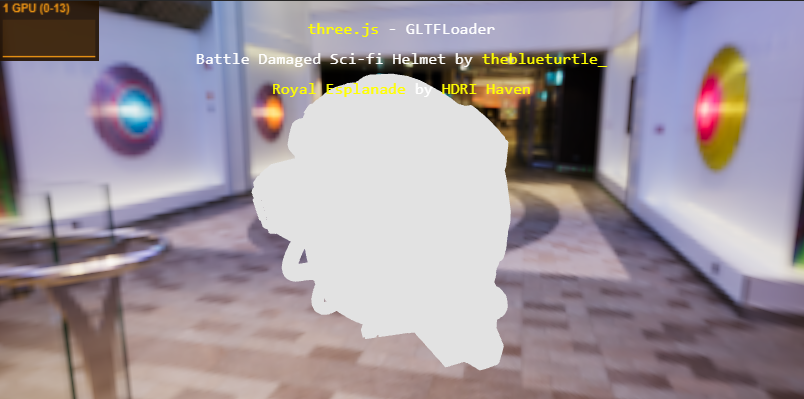
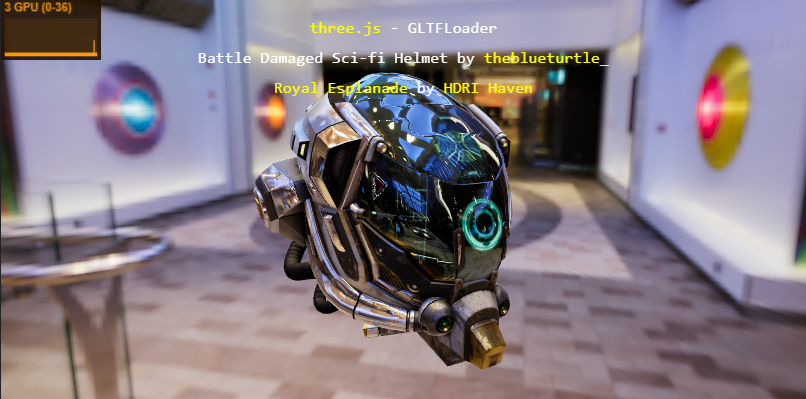
And some screenshots showing the time difference on my lower powered Surface Laptop between rending the GLTFLoader example with a basic material vs the default standard material:
| | MeshBasicMaterial | MeshStandardMaterial |
|---|---|---|
| time | ~1ms | ~3ms |
| screenshot |  |  |
The extension actually reports times in nanoseconds so it would be nice to display another decimal or two of precision in the stats panel (doesn't look like that's possible at the moment). As an aside this extension generally seems really useful. I plan to use it to auto-scale the scene fidelity based on measured performance which I was previously doing based on JS frame time and using it to find which objects and shaders are a bottle neck in scenes.
1 Like
Thank you, this looks great.