Performance Profiling Tools (CPU, GPU)

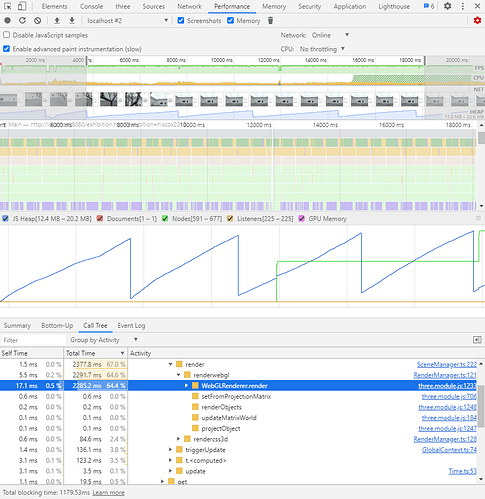
I’m trying to find bottlenecks in the performance of my three.js application. So far I found the following tools:

  1. Chrome Builtin Runtime Performance Profiler (CPU)

Great overview of what calls happen and how much CPU time they consume. Also shows the JS Heap, to see how much garbage is being generated and how often the garbage collector runs.

  1. Three.js Developer Tools (Scene, Memory)

Gives you an easy way to see all scenes, all objects in those scenes as well as materials, geometry and textures. Also handy: Has webglrenderer.loginfo() builtin to quickly see the number of rendered triangles and draw calls

  1. Spector.js (WebGL, Shader)

Even though it was initially developed for Babylon.js it works very well with any webgl context. Shows every draw call in great detail and also gives access to the used shader code of the materials

What I’m missing in this list is an easy way to profile GPU times for the shaders. Are there any tools out there that can do that and am I missing any other useful tools? :slight_smile:

7 Likes

One feature that comes into my mind is the usage of the Chrome developer tools in order to show the GPU activity:

Thanks for the suggestion! For me, that info is quite thin. I guess I can try to connect the time I have longer GPU times with the information what happens on the CPU :thinking:

Um, I’ve never seen a tool that allows you to profile the exact shader execution times (if that is what you are looking for). Probably because of the massive parallel processing on the GPU.

Well, there are some tools from hardware companies that do that, e.g. Apple’s profilers are pretty awesome (Apple Developer Documentation). For Desktop Intel GPA is a nice general purpose tool, that can give you some insights on your bottlenecks. Sadly I was not able to hook it to the browser.

I totally agree, I doubt that there is one magic addon or builtin browser functionality, but I was hoping that maybe some external tool might be able to hook into the webgl context to give a better understanding of vertex and fragment shader times. Firefox also had a live shader editor once, but sadly they deprecated it. :man_shrugging:

1 Like

External profiling tools might help too, but isolating the bottleneck is the most obvious approach to find the issue, as other things going on can contribute and cause something else to appear like being the bottleneck. I experienced a couple bugs before that won’t relate to the app but the browser API or possibly driver related that can temporarily appear, especially when a shader bomb dropped.

Interesting point, thanks for the insight!
Can you recommend any external tools you used for profiling?

As for telling, if the application is GPU bound, I currently just reduce the render resolution to see if it runs better then, which gives me an idea if the pixel shaders are too heavy. I also learnt that there is Scene.overrideMaterial (https://threejs.org/docs/#api/en/scenes/Scene.overrideMaterial), which sounds quite handy.

I don’t often use them for specific shaders as it doesn’t really help asides of clearly expensive ones that require a lot optimizations (i use them for overall optimizations rather than debugging), these can be improved outside, but only roughly to the average power of the target devices. There are so many different possible devices, cards, driver versions etc with a huge span from low end to high end.

That is a very rough estimate ^^ there needs to be a huge chonk to drop the performance significantly, in these cases it is often enough just to look at the material (with the camera), even if one appears to be the issue i would always isolate it down step by step and remove anything else that can influence the result.

For optimizing a specific shader i would always do it externally or even just a isolated basic environment with something like shadertoy on a quad and raising resolution till the performance drops. But that’s all just for fragment only related cases.

3 Likes

:blush: Yeah, that is true, it’s very rough ^^
Looking at specific objects with the camera is what I do as well. But from that it is still quite hard to tell for me, what the biggest impact on performance is (reading basis texture, handling vertices, applying IBL, applying normal map). But you’re totally right, peeling the material and removing one map at a time should help pinpoint the problem it comes from the material.

That’s a really good idea ffor custom shaders, thanks for the input!

Maybe somewhat unrelated. I ran into an issue while optimizing my game, some piece of code runs super fast in an micro-benchmark, and I think to myself:

Congratulations Usnul, you are adequate.

But when I run the same code in the context of the game, together with all of the other messy parts - it suddenly does not behave the same way :open_mouth:

Being an amazing software god that I am :goat:, I realize that there is a CPU cache, and that my efforts in optimizing a piece of code in isolation translates to complete garbage when running together with other stuff that competes for the cache space. :sweat_drops:

I’ve had a lot of cases in my past where I would optimize the heck out of something on a benchmark, only to realize that a super-naive approach with no fancy data structures or algorithms would run faster given a broader dataset or competitive context (other code running on the same context).

So… profiling. You know that something runs slow, but often have no clue as to why. For example, I have had 20-30% performance gains in some scenarios by simply removing tiny memory allocations that were unrelated to actual code that was showing up as slow in the profiler. This resulted in lower memory fragmentation :rainbow_flag: , less cache thrashing :fish: , smaller GC :wastebasket: overhead or… something? The point is - it was faster. :man_shrugging:

Another thing, profiling. It’s the observer effect.

When your profiler gazes into the code, the code gazes back at the profiler (c)

You sometimes get incredible (literally) results in some cases with and without the profiler. This has gotten better over the years, but it still holds true. For example, I run a profiler for 1 minute on a piece of code that uses function X 1000 times per frame, and after 1 minute the profiler tells me that it had 0ms total runtime.

Ok, Profiler. Whatever you say, Profiler.

5 Likes