Now it’s much better ![]()


Looking forward to put hands on your engine and try my point cloud rendering with FX in VR project on it.
Now it’s much better ![]()
Looking forward to put hands on your engine and try my point cloud rendering with FX in VR project on it.
Another demo link
This is an actual arch viz scene done in blender, I scaled down the textures to something reasonable, but otherwise the scene is as-is, warts and all.


The entire scene is ~170Mb with
This is stunning, it looks amazing!! How are you managing draw calls in this scene and how many do you have currently? have you considered trying to use ktx2 CompressedArrayTexture’s to store and assign all materials seperate texture channels as layers? How to create a Motion Vector map - #24 by vis_prime
a quote from the thread…
The number of draw calls is roughly 111, i.e. the number of materials.
This is not exactly true, as there is some fixed overhead.
Here’s a basic breakdown of how a frame is rendered in Shade:
rg32uint texture, with mesh_id and triangle_id. Actual rasterizer is dead-simple, just about as complex as a depth pre-pass shader.At this point we have a Vizibility Buffer and we spent 2 draw calls for actual geometry drawing so far. We also spent something like 20 draw calls for depth pyramid, but it’s relatively cheap as each pass processes ~33% of screen pixels (mip mapping)
Next is material pass, we fetch mesh_id from viz buffer and draw “depth” in a depth-only pass, where “depth” value is the material ID for the mesh at that pixel.
Next we do a draw pass for each material, with depth test set to equal and depth value being set to match material ID. Essentially we abuse depth-test hardware to get 0 overdraw. And I don’t mean it hyperbolically, like “virtually zero”, I mean that we run material shader once per-pixel only for pixels that are actually visible in the final render.
As a result, cost of texture switching is actually very low. Also, the material shader is uniform, meaning we don’t actually do any lighting here, we output g-buffer instead, things like roughness, albedo, normal etc.
The advantage is that we scale incredibly well with material and texture counts as well as number of instances and geometry size, at the cost of high GPU bandwidth.
I can’t say if this is a good trade as it depends on your usecase, obviously. But if you’re dealing with large scenes, and/or you want to run some post-processing, it’s definitely a huge win.
I did think about it, the problem is uniformity, you have to force every texture to have the same dimensions. I’m not exactly opposed to it, but it seems like a big ask. I already have texture resizing shaders that would make this transparent to the user, but loss of quality due to scaling would be a nasty surprise.
One more issue is the layer count limit, I actually use a texture array for ray-tracing path, that is, I have a special code path to do full inline ray-tracing, and there you have to have access to all textures at the same time, so I pack them into a texture array.
However, even then I ran into an issue, larger scenes, like Lumberyard’s Bistro
This scene has 400 textures
WebGPUDevice.limits.maxTextureArrayLayers is 256 by default
So, you simply can’t support larger scenes, full stop.
I had to get creative, I emulate texture sampling in shader, I skip mip maps and I treat the texture array as an atlas, meaning that I pack multiple textures per layer. This works alright for ray-tracing API, as I mostly use it for global illumination, so loss of texture quality and mips is something quite acceptable there
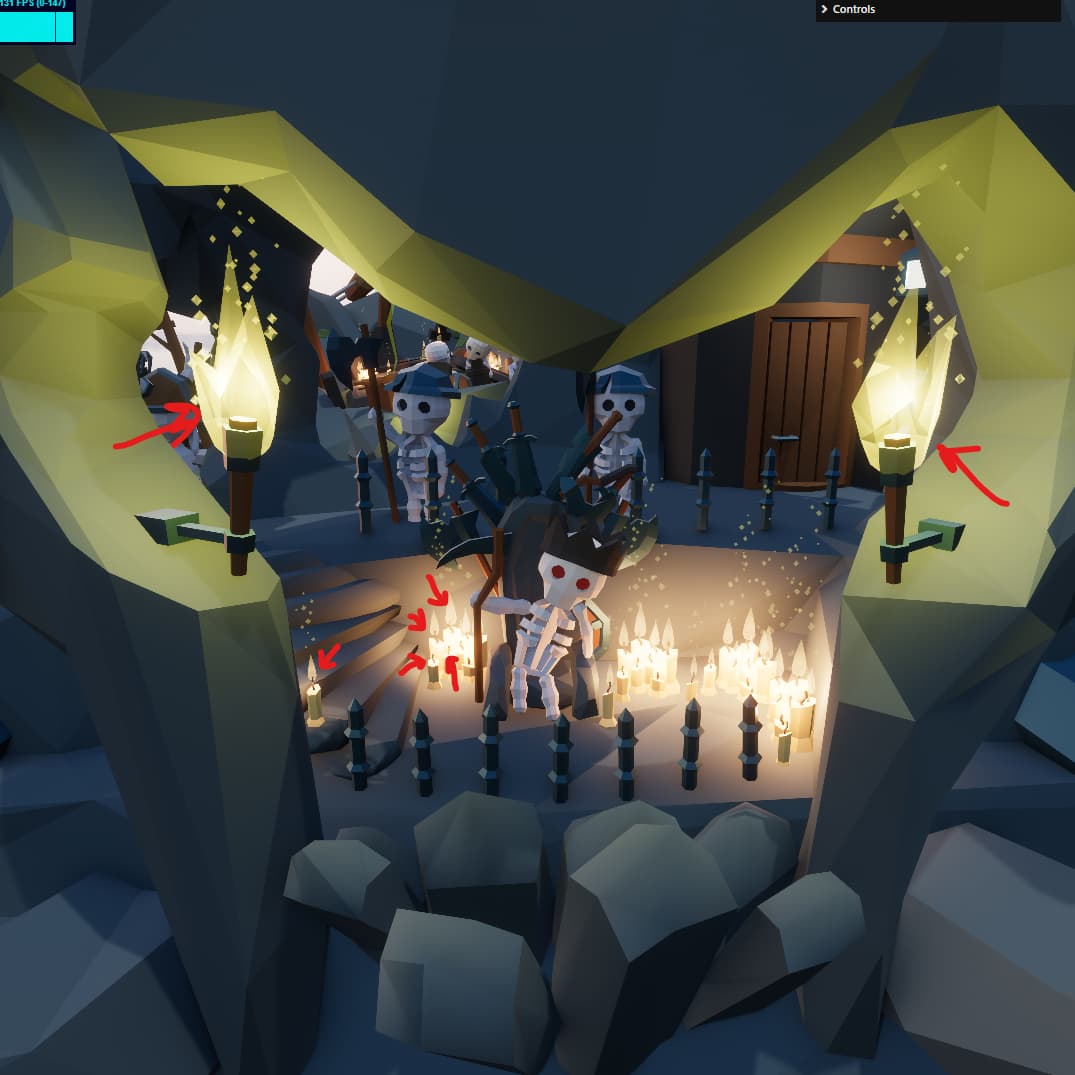
Here’s an example of what ray-tracer sees with all texture resolution fixed at 128x128
It looks surprisingly good for such a low resolution, but this is not acceptable for general usecase.
So, in short - the best asnwer would be bindless textures, but alas, this is not part of WebGPU spec and doesn’t look like we’re going to be getting bindless resources anytime soon.
The other alternative, which I consider to be workable would be virtual textures. In fact, virtual textures have the benefit of managing memory as well, since your “physical” texture is where sampling will be done, and it’s quite small, so you’re going to be getting way better cache utilization on the GPU. Virtual textures are hard though, and even though I have implemented them in the past and on WebGL, which is a less powerful API - it’s still a lot of work to do a proper solution, so something to look into in the future.
Anyway, thanks for the interesting questions @Lawrence3DPK
Thanks for such an elaborate and clear reply, this is really insightful!
Going down some what of a rabbit hole here, could layers themselves be divided into sprite maps? For example 30% of layers could be comprised of smaller texture atlases, let’s say 8 x 8 atlases of 256 squared textures, 30% could be 4 x 4 atlases at 512 squared, 30% 2 x 2 atlases at 1024 squared and the remaining 10% as hq 2048 textures? Even thinking about this almost hurts and the more challenging / complex the idea gets as it’d take a completely custom pipeline (file type specification?) to manage and assign every packed texture to thier relative material / channel / atlas id counterpart ![]()
Yes, but the worth of doing that is somewhat arguable. First issue is the packing, it’s not exactly free. I have a sophisticated packer implemented in meep which is incredibly fast, but it needs a lot of memory to keep current state. Essentially this is an allocator problem. Instead of 1d as in with most memory allocators we are now going 2d in texture space, and then we say “hey, that’s not hard enough” and we add layers, so it’s a 3d allocator.
Not to say that it’s impossible, it very much is possible, but the complexity I believe is not worth the trouble.
One simpler approach would be just to bin your layers, say N layers are dedicated to texture slots of resolution X by Y where X and Y are whole divisors of the layer resolution.
Of course one of the problems is that you kind of have to allocate all of that texture space ahead of time, to avoid re-allocations which would absolutely destroy your performance.
Your texture lookup gets more messy as well, now you have to carry not only slot, but also the size of the texture when trying to read it on the GPU. In my case, just a single u32 ID is enough to reconstruct UV bounds for a texture, because each slot is the same size.
But as much as it’s an interesting thought experiment, consider 2 more things:
And that’s to say nothing of data types and channel counts. For example, say you have an HDR texture, you’d be hard-pressed to put it into rgba8unorm texture array. Or, you might have a single channel texture, like roughness or a light map for example - you’d be wasting 3/4 of the space on unused channels.
I’m all for over-engineering things in general, and I think it would be an interesting research project, but in my experience the more you fight against the hardware and the API (WebGPU and GPU architecture), the more pain you incur. And the less likely you are to beat the defaults.
That said, if you go down this route - you might enable some usecases that are simply impossible without this, such as ray tracing. There’s a lot of fun and cool stuff to be had here, but I think you really need these unique and special use cases to make it worth it.
Added vertex color support, not a huge thing since it’s somewhat of a niche tool. If you’re in CAD world - material color tends to be a better choice, and when you’re in PBR flow - vertex color is just unncessary.
But either way, it’s there:
the “before”, and here’s the version with vertex color support:
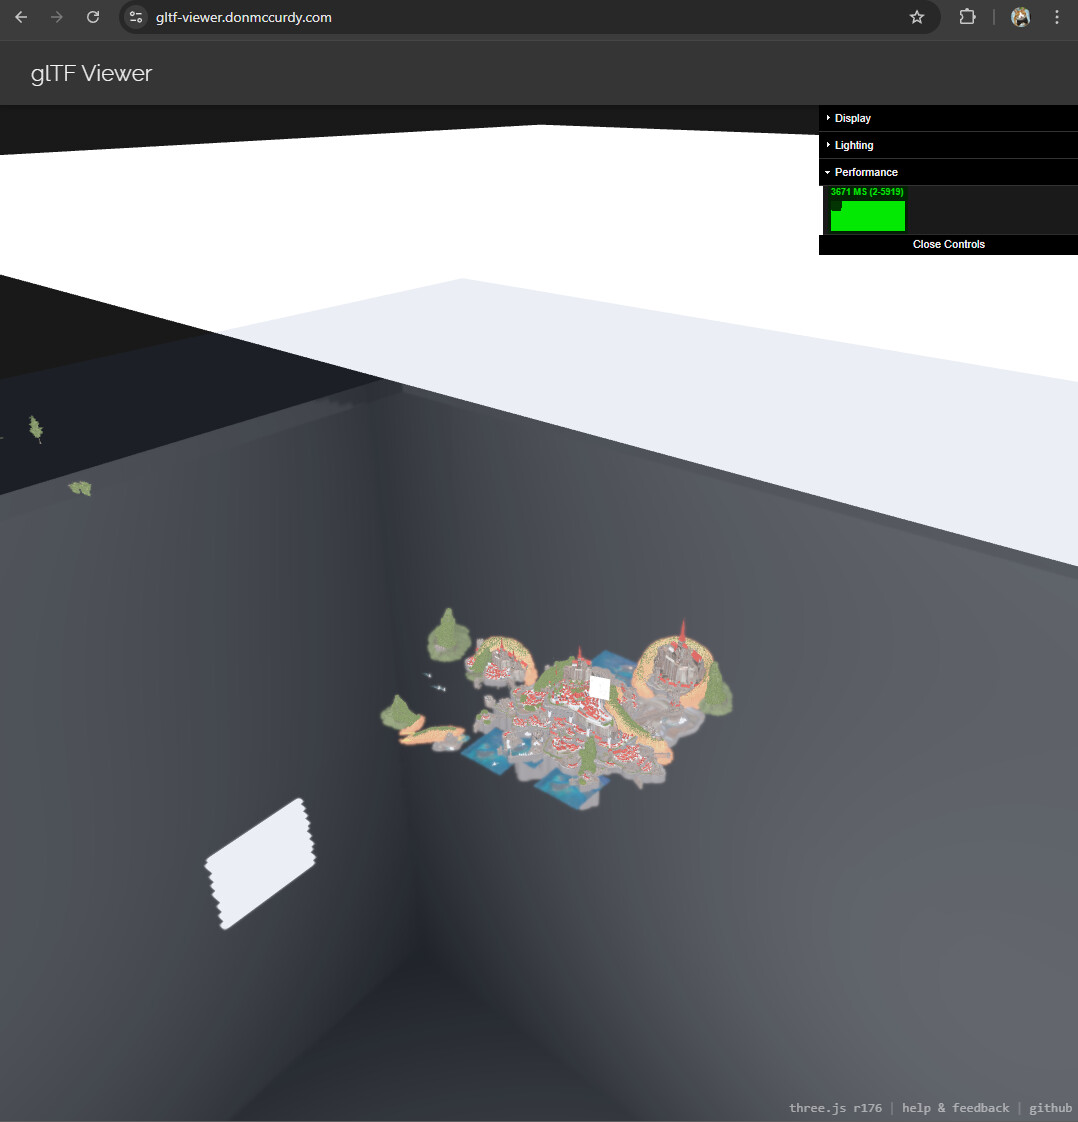
Pretty close to three.js too, here’s a comparisson with the gltf-preview, first is three.js r176
Here’s current version of Shade
Also implemented a stochastic PCSS shadows, for now just directional. This is for devices where ray traced shadows are too much of a burden. It’s somewhat funny that PCSS shadows with just 5 “nearest” taps and TAA works incredibly well.
Here are a couple of shorts of just the shadows
Here are a couple of things to note
There are shadows from very far away, so they are quite blurry, contact hardening is working as intended.
And just to prove that there’s nothing untoward going on, I’m drawing shadows at a very low resolution, here’s the same shadowmap without filtering:
Other than this, fixed a few bugs, and managed to get rid of an extra render target, which reduces bandwidth by a bit.
Finished implementing spotlight support as well, integrating spotlights into clustered rendering is a bit of a pain.
That’s about it for now.
In case anyone is interested, my engine is very opinionated when it comes to rendering, vertex format and layout is fixed, this makes a lot of the code much simpler than it would have to be otherwise. Of course, I don’t want to limit the user in what data they can bring in, so there are efficient converters that transform the data at load-time into the right form. This is how I can get away with using just 8 bytes for the entire tangent frame for example (vertex normal + vertex tangent), where normally you would use 12 just for the normal and another 16 for the tangent.
Out of curiosity… which factor(s) contribute to shadow alignment, and/or squareness?
Since things appear square, it must be the former?

The FPS is uncapped in this one, I would appreciate any comments. If you can share your frame rate and GPU model - would be much appreciated ![]()
I spent past few weeks reworking a major part of the engine, namely the meshlet expansion.
So… in a nutshell, Shade is a meshlet-based resident renderer. What that means is that instead of drawing whole meshes, the engine works on clusters of up-to 128 triangles. This makes a lot of things much easier.
In fact, it makes things so much easier - the “mesh shaders” are a staple modern graphics engines. Everyone and their dog are using them in advanced renderers. We, The Plebs of The Web™, alas, have no mesh shaders.
In the past, the work that Shade does looked like this:
I came to realize that triangle buffer at the end was quite wasteful. It makes a certain amount of sense, but just drawing meshlets is enough for most work loads and culling individual triangles is, while useful, isn’t worth the effort most of the time. That is - if you cull triangles, you end up drawing fewer triangles, but the effort you spend culling them is about the same as what you’ve saved.
So, I dropped the last phase and just draw meshlets directly now.
This works quite well, however, there’s a bottleneck in the whole thing.
Meshlets are cool because they have fixed number of triangles. Nice. Predictable. However, how many meshles are in a mesh?.. That’s the question. Why is an important question? Because when you expand meshes to meshlets on the GPU - you’re going to have terrible coherence, some threads will spin a lot, some will finish immediately. Consider the following sketch of an expansion shader:
@compute
fn main(@builtin(global_invocation_id) global_id : vec3<u32>){


    let input_element_index = global_id.x;
    let mesh = meshes[input_element_index];

    for(var i=0; i< mesh.meshlet_count; i++){
       output[atomicAdd(&output_counter, 1u)] = mesh.meshlets[i];
    }

}
This is a very sketchy sketch, but I hope it’s enough to illustate the problem. You have, say, 2 geometries:
1 meshlet with 1 triangle1,000,000 triangles and 7,813 meshlets (1,000,000/128)So some threads in a single thread group will finish immediatelly, and others will spin for a looooong while. It’s a problem, because thread groups, and I’m going to oversimplify here, are executed togehter. So if you have 32 threads and 31 of them are done and just one is hanging - those remaining 31 are not free, they can not do any other useful work, they are locked until that last one is finished.
So, one problem is efficiency, another problem is time. If a single thread takes 5ms to expand a complex mesh - that’s how long you’ll have to wait for the shader to finish, even if all of the other work was done in 0.0001 ms. 5ms is not too bad, but if you’re drawing main view and 3 shadows views, you’ll be stalled 4 times by 5ms, so your frame time will never be better than 20ms or 50 FPS, no matter what else you try. It’s a major concern.
I’ve addressed it fairly simply, by adding an extra layer of expansion. First we expand meshes to “meshlet batches”, of up-to 64 meshlets per batch, and then we expand batches. This takes the edge off, instead of 7,813 cycles per thread, we’re down to 123 (7813 / 64), which is acceptable. Not great, but acceptable.
Recently I’ve implemented an efficient prefix sum shader, so I’m going to transition to that eventually.
In real terms, meshlet rendering enables us to do GPU-resident drawing even on WebGPU, and that in turn gives a huge performance benefit.
A while ago I found blend file for Blender 3.3 splash
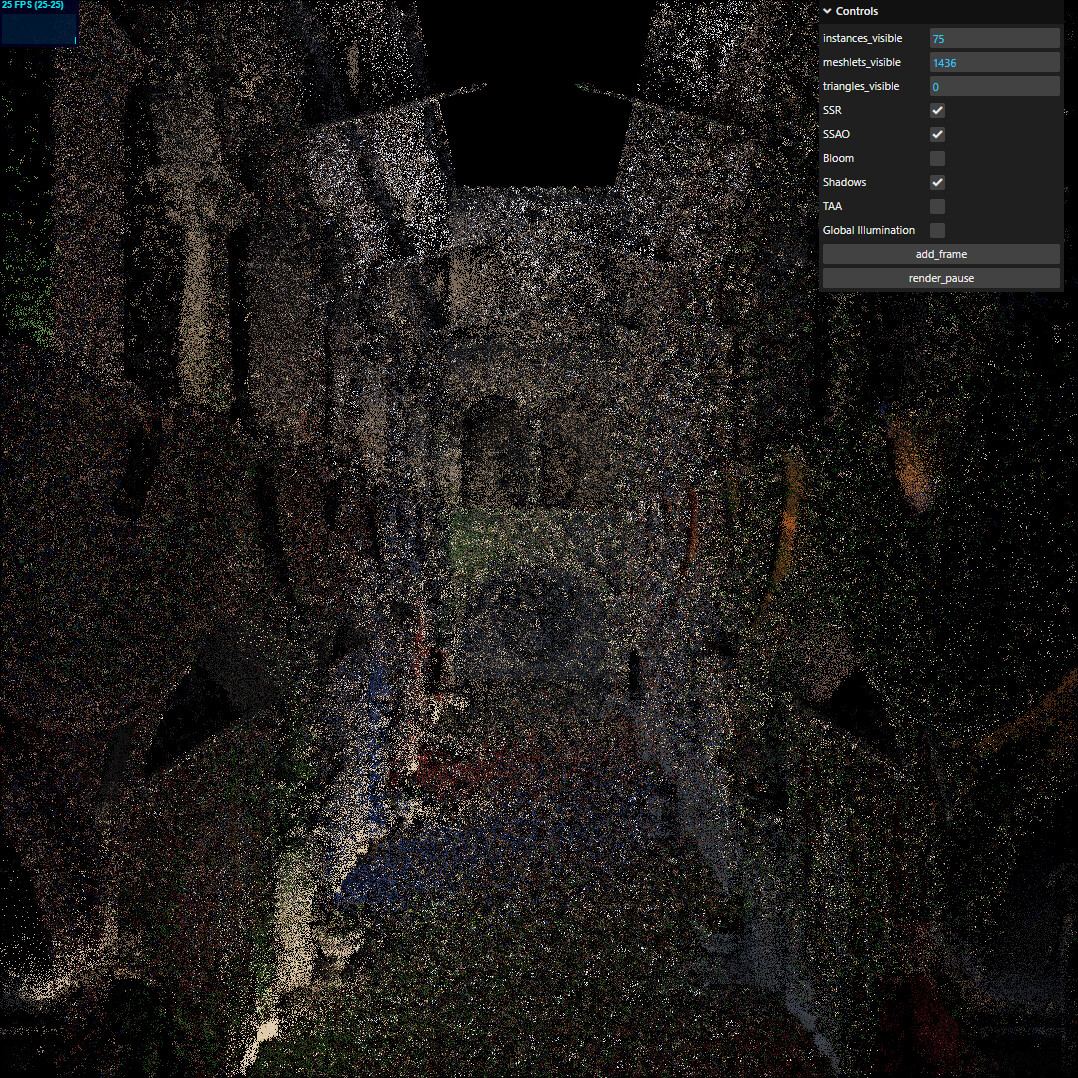
This little monster is a great example in what NOT to do for interactive graphics, here are the stats:
374,734353717,869,562 ( yes, 717 million triangles )Three.js loads the scene, admittedly it doesn’t run well
I switched from FPS to frame time, because 0 FPS is kind of pointless to talk about. So frame time is 3671ms, or just over 3.6 seconds. This gives us a respectable 16 FPM (frames per minute).
Shade, running GPU-resident draw gets us 21 FPS on average, or about 47ms. Around 78 times faster than three.js (3671 / 47 = 78)
Anyway, I’m thankful to both blender and Piotr Krynski for releasing the model, which served me well as a stress test.
How does one learn these things? I have a vague understanding of cache coherence, but even that may be an overstatement. I don’t really know how processors work. What are the prerequisites?
There is a lot of information out there, but sadly, not in a teaching form. I believe the biggest issue is that things change all the time, and because the topic is so complex and obscure - it either takes a long time for information to appear in a digestible and comprehensive form, or people just don’t bother, as the audience is going to be very small.
In a nutshell, a GPU is SIMT system, which stands for Single Instruction Multiple Threads.
What that means is that you have a piece of code, say like this one:
if(x > 5){
   color = vec3(1,0,0);
}else{
   color = vec3(0,0,1);
}
And if turned to assembly it will look something like this:
GREATER $1 x 5
COND_JUMP $1 L1 L2
LABEL L1:
ASSIGN color vec3(1,0,0)
JUMP L3
LABEL L2:
ASSIGN color vec3(0,0,1)
LABEL L3:
Each thread will execute EVERY line of assembly. If the actual conditional jump should not be happening - the instruction will be treated as a no-op basically, but you will still move the program counter through each line. In fact, there is one program counter for the set of threads.
Here’s what the GPU might look like at the hardware level
Each block of threads looks something like this:
The actual topology and number of individual units varies from vendor to vendor and from product to product.
So now, if you imagine say a loop:
for(var i=0; i < X; i++){
  // do some work
}
If X is equal to 1 for all by one thread in a group and for that remaining 1 thread X = 1000000, the entire block of threads will be stuck executing those remaining loops. No useful work will be produced by those threads and no extra output generated, but they will still spin.
When we talk about coherence, there are two types:
I mainly mean the second kind here, but you’re absolutely right to talk about cache coherence
I added “memory” on my diagrams here, specifically to highlight that. The memory is very limited, especially the bit that’s attached to a thread block. There are two oopsies you can commit with respect to that:
I’m not going to go into specifics as to why 1) is bad, but 2 is relatively easy to explain: when you fetch from memory, it’s a time consuming request that also competes with other requests. When you fetch data from memory, you typically don’t bring in just 4 bytes or something like that, you typically bring in larger chunks. Which means further the data is apart from each other - less likely that extra data that comes in a single fetch is going to be useful, it’s just a pure waste.
Second issue with that comes from the first, each fetch populates cache, and the further apart the requests are - the less likely data in cache to be useful. Now imagine we have two threads, one asking for memory from address 0 and one asking for memory from address 1,000,000 - these are very far apart, the entire execution is likely going to be stalled because you can’t continue until both requests are satisfied.
Hope this helps. GPUs are a bit like magic at a first glance, and there’s a lot that’s very complex about them, but in many ways - they are very simple machines.
Good luck to you! Depth buffer management is indeed a big disadvantage of webgl1, but threejs itself has nothing to do with it. You haven’t discovered anything new, it’s just that the time for full implementation of webgpu hasn’t come yet.
I think it is time to reorganize @Usnul posts into a collection of educational materials.
Are bottlenecks multiplied by use of secondary WebRTC-type draft/spec? In other words, WG only opens a subset of features from their foundation of limiting security. In other words, in context of a schema for proxy game vs bank validator. In other words, in context of iFrame versus same-domain.
Thanks, I appreciate it
Could you expand a bit more on this, I’m not sure what you mean. Shade is fundamentally different, in that it is GPU-driven renderer, where three.js has to issue 374,734 draw commands, one per mesh, Shade can do it in 1 (grossly oversimplifying, but the number of fixed).
Shade does make extensive use of the depth buffer for occlusion culling, so it draws less, which is the only thing that comes to mind here, shade also is a visibility-buffer-based renderer, so it skips expensive shading operations and has 0 overdraw as a result, at least in the shading. Shade also uses depth-based material sorting in port-visibility passes. So there’s a lot of depth-relevant stuff in there, but I’m not sure what you’re referring to, is it any of these techniques or something entirely different?
![]()
I think I have invented a few things, but I will be the first to admit that this is a very engineering-intensive project, there’s not too much invention going on. There is research, there are a lot of prototypes, but not so much in a way of invention.
“I stand on the shoulders of giants”
Frankly, I’m amazed by the breadth of research available, mostly free even. I often find myself reading a paper from 80s on something that I thought was my own original idea. Quite a humbling experience, but also motivating. Imagine - whatever crazy idea you have, you don’t need to invest years validating it - someone has already done the hard work, you just need to find it.
I don’t think three.js will be able to compete on performance. That’s not a bad thing necessarily, three.js and Shade are designed for different purposes and have different goals as projects. I love three.js, and Shade’s API is in many ways inspired by three.js.
I think @mrdoob, @Mugen87, @WestLangley and others are doing an amazing job. Personally and professionally I have used three.js for over a decade now and I don’t see any reason why I wouldn’t in the future.
That said, three.js is not designed to be a GPU-driven renderer, and the design differences are pretty fundamental here. Three.js is not designed to be anything other than a forward renderer either, this can change more easily, but I doubt it will - for the same reasons of philosophy.
This is not a bad thing, most projects don’t need thousands of meshes, materials, geometries etc. And where you think you do - you can usually just rework your assets, heck, I know I did exactly that many times.
People often say “If you don’t like X - make your own”, and that’s what I did. I’ve spoken out for a different philosophy for a few years, starting about a decade ago. I didn’t have the skills or the time necessary to make my own.
I did build on top of three.js, and as I built more and more - I eventually found myself with the time and the skills. And here we are. I don’t dislike three.js, I love it. But for what my philosophy is - it’s not a good fit, so I built something else ![]()
Hope that makes sense. I know people are touchy when you imply that three.js is bad in any way, and I think that’s good, means you love the thing. I do too ![]()
You are doing everything right. I also encountered limitations of webgl, drivers, it is to put it mildly terrible. You were able to bypass it by writing your own logic thanks to new features, it is great!
A small update. I was re-reading a presentation by Tomasz Stachowiak on Screen-Space reflections, and decided to implement the ray re-use mechanic that he proposed in there
Basic idea is to just take already traced rays from neighboring pixels and treat them as though they were traced from this one.
Tomasz used 7x7 block for neighborhood
I went with the same.
It seems like this is just your standard denoising/blur. You take nearby pixels and smash them together. In reality it turns out a lot more elegant.
Since we work with already traced rays, what we have are proper world-space rays and hits
We have the origin and direction
And we have the actual surface hit, with world position, normal etc.
When we reuse rays, we can check whether or not if we cast a ray from our own pixel in the direction of the neighbor’s hit, if that would would be a plausible ray. Here’s my take on that:
let sample_direction = normalize(sample_hit_position_ws - position_ws);

// check visibility
let sample_normal = decode_g_buffer_normal( textureLoad(tNormal, sample_hit.position.xy, 0).xy );

let ray_hit_valid = step(0, dot(-sample_direction, sample_normal));
let ray_cast_valid = step( 0, dot(sample_direction, this_normal) );

let sample_visibility = ray_cast_valid * ray_hit_valid;
Basically, we make a fake ray that would produce the neighbor’s hit but from our pixel, and we ask 3 questions:
We can also apply importance sampling to that ray, which elegantly deals with mirror surfaces for us. That is - a neighboring ray will only have any contribution for a mirror surface if it actually hit in the exact direction of our primary ray.
As for results, it’s a little hard to properly quantify, so here are two screenshots on Sponza with just the reflections, first without ray reuse
And now with
As a reference, here’s full render
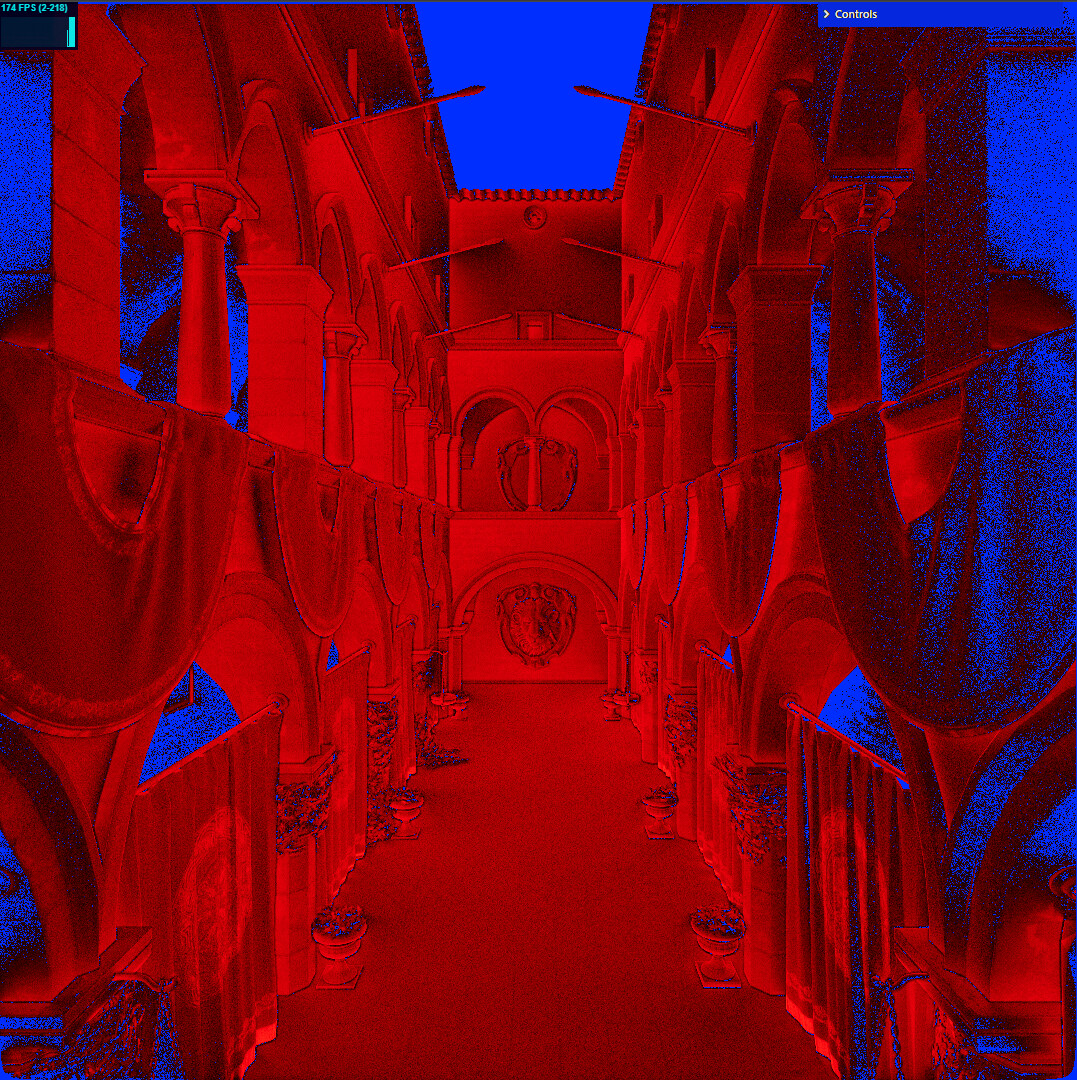
To make it a little more intuitive, here is the same thing with false color. Red means there is a valid sample, blue means the ray was unreliable or didn’t hit anything at all. First without ray reuse:
And now with
And just because we can, here’s what the picture would look like if we trace infinite rays for each pixel
That is - blue pixels are those where we simply can not get any information with just screen-space traces, so this the upper bound of what’s achievable.
It’s not a game-changer, but it does reduce noise by a lot, giving the denoiser more to work with.
And to show that this doesn’t mess up mirror reflections, here’s a PicaPica scene.
And here are just the reflections, if we set all materials at 100% metalness and 0% roughness (perfect mirrors)
As you can see reflections are crisp.
All in all, this doesn’t add much overhead. I didn’t measure it, but I would estimate maybe 3 times slower resolve stage as a result of this technique being introduced. However, resolve is already very fast, it’s the tracing that takes the most time, I guess in the end it would barely register when you put everything together.
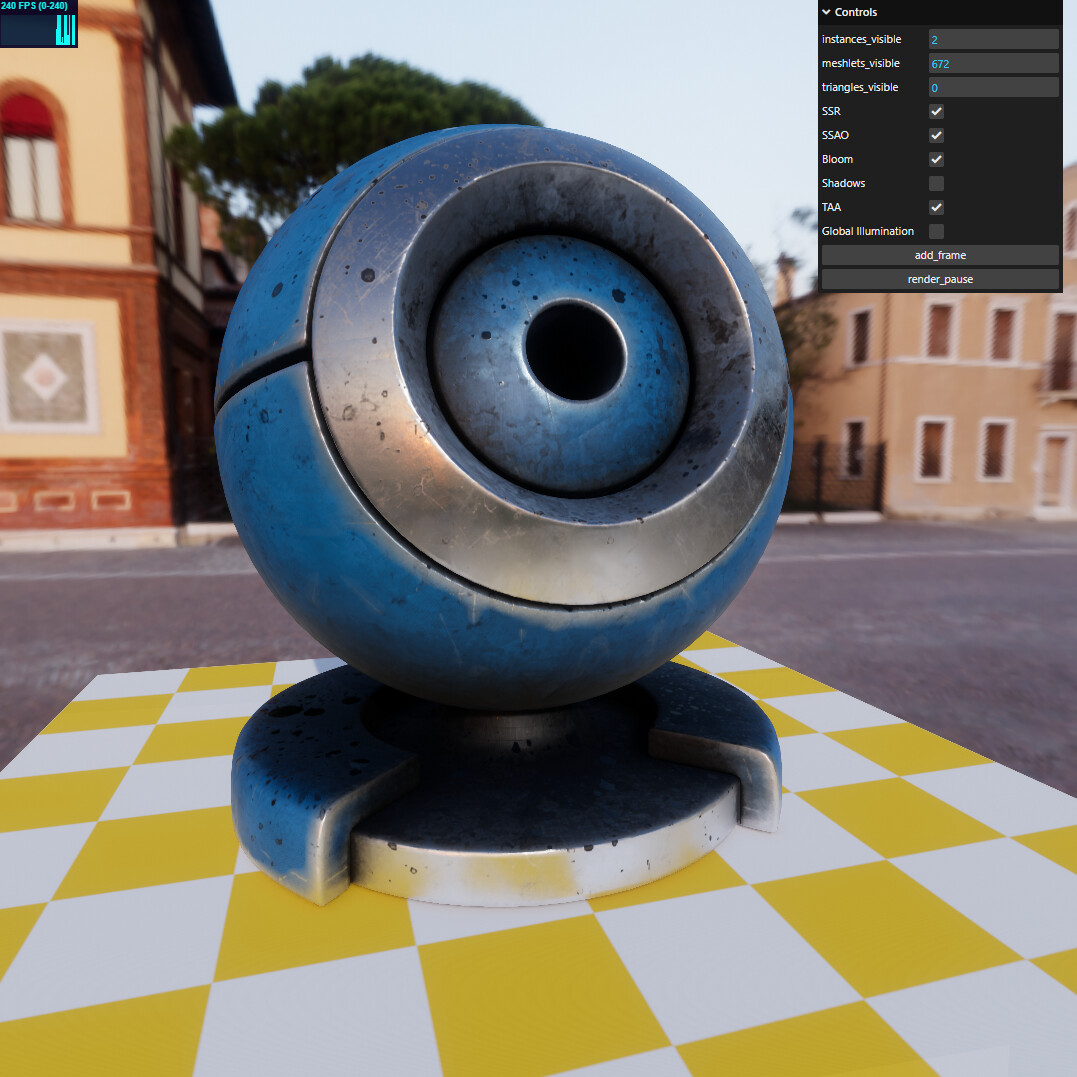
As a final thing, I still think that SSR is amazing and makes a massive difference, so here are a few extra shots of what it does.
here’s a material ball with and without SSR
And here’s a shot from the Bistro scene
A small update.
I’ve had a bit of an issue with alpha textures darkening in mips. It’s a fairly well-known issue. So I implemented alpha pre-multiplication pipeline. Here’s what that looks like before:
and after
Hopefully it’s clear that all of the alpha-tested stuff is significantly lighter now. Especially the tree in the middle and the grass on the ground.
Next I played a lot with shadow terminator, I’ve had implementations based on following papers:
I’ve been using the one by Estevez in the past, but after transitioning from raytraced shadows to shadow maps, I realized that there was little to no extra benefit. So the terminator fix is currently disabled.
Here’s a shot of Sponza with the terminator fix disabled
And here’s a visualization of terminator fix value (Estevez)
Hopefully you can convince yourself that those fixes are redundant. So, lot’s of work, but hey - now I know that it’s pointless. It’s very noticeable with ray-traced shadows though.
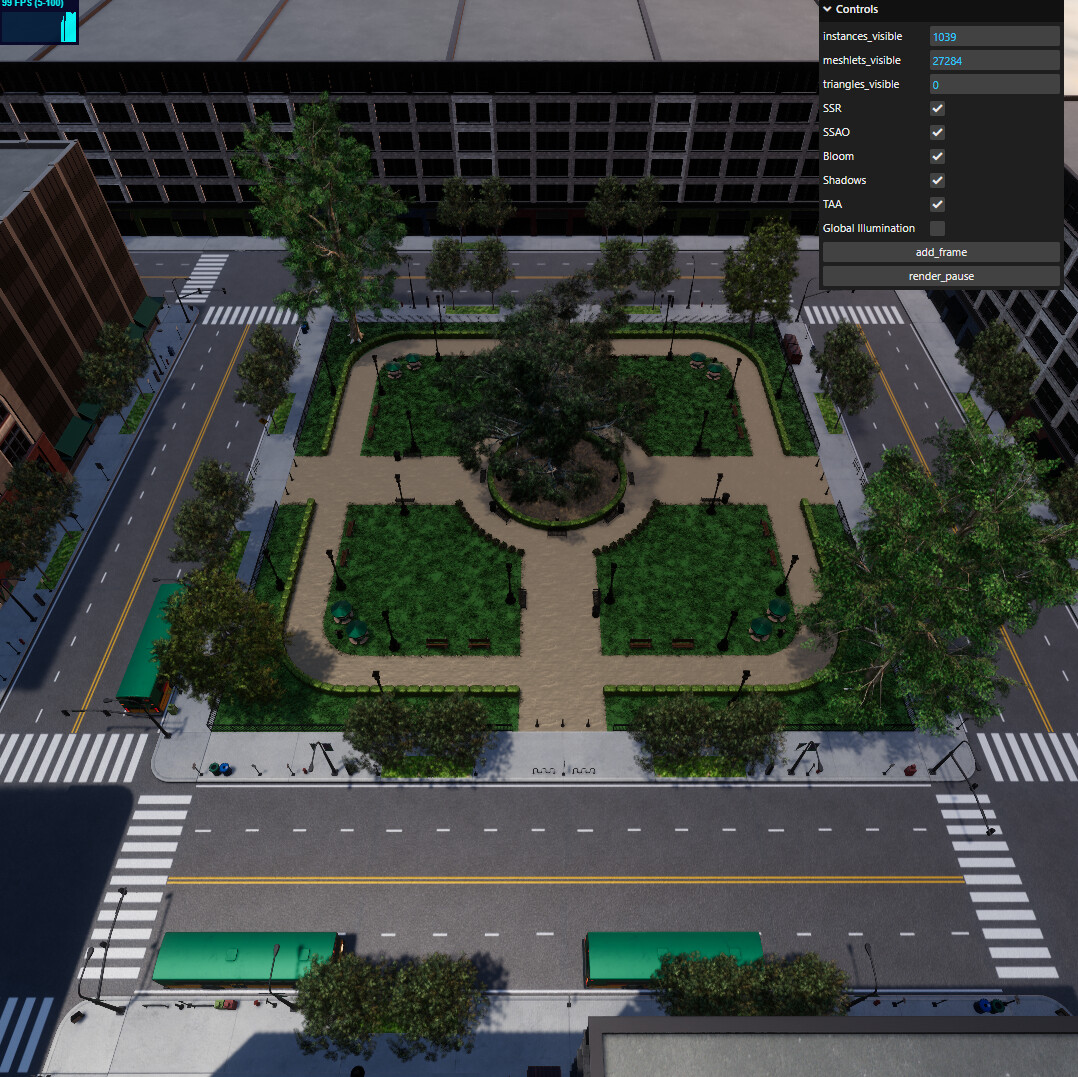
Beyond that, I spent a lot of time optimizing shadow map rendering. I don’t have concrete decoupled numbers, but I have been using the Emeral Square scene as a benchmark, as it has a ton of geometry and alpha-tested vegetation
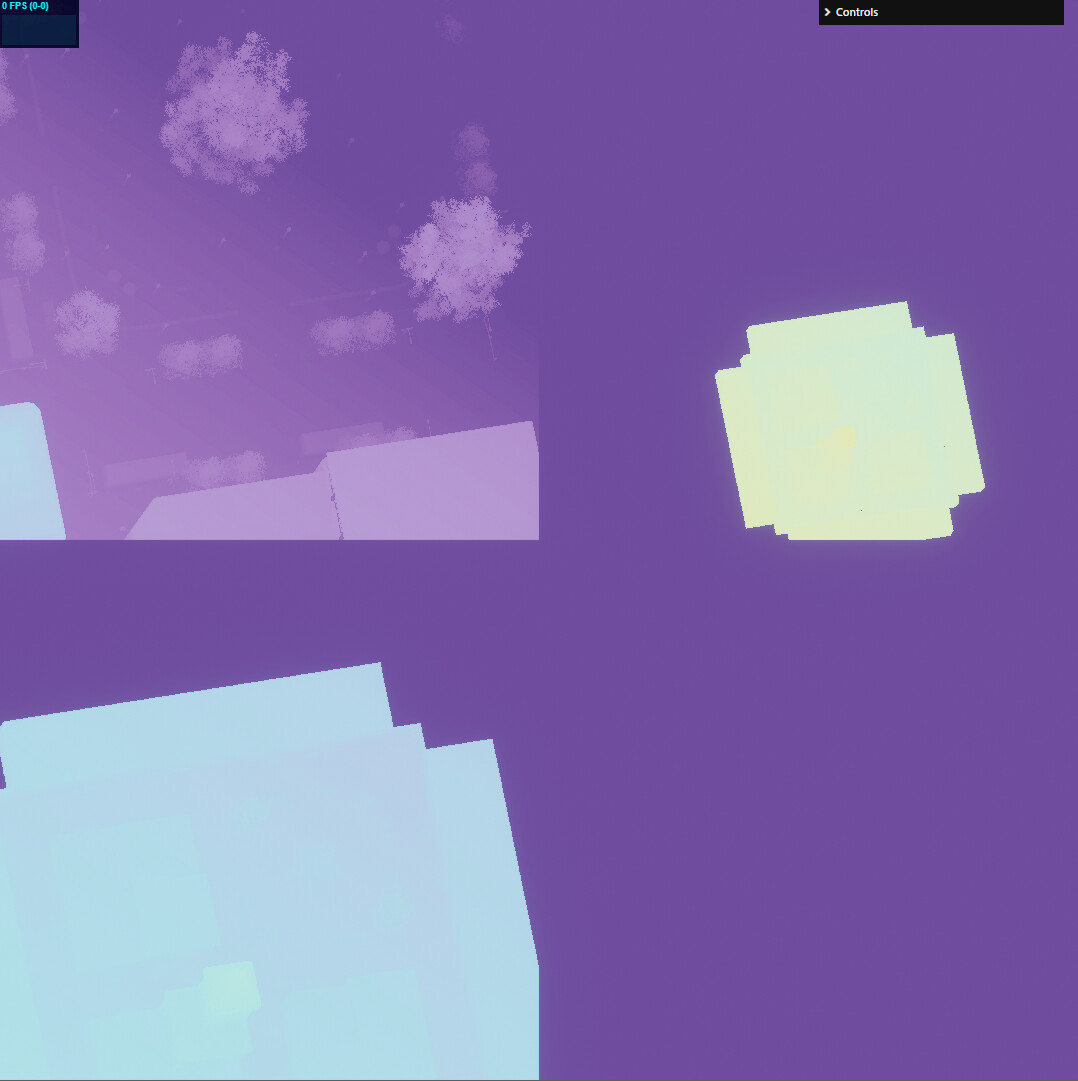
Here’s what the shadow cascade looks like in the atlas
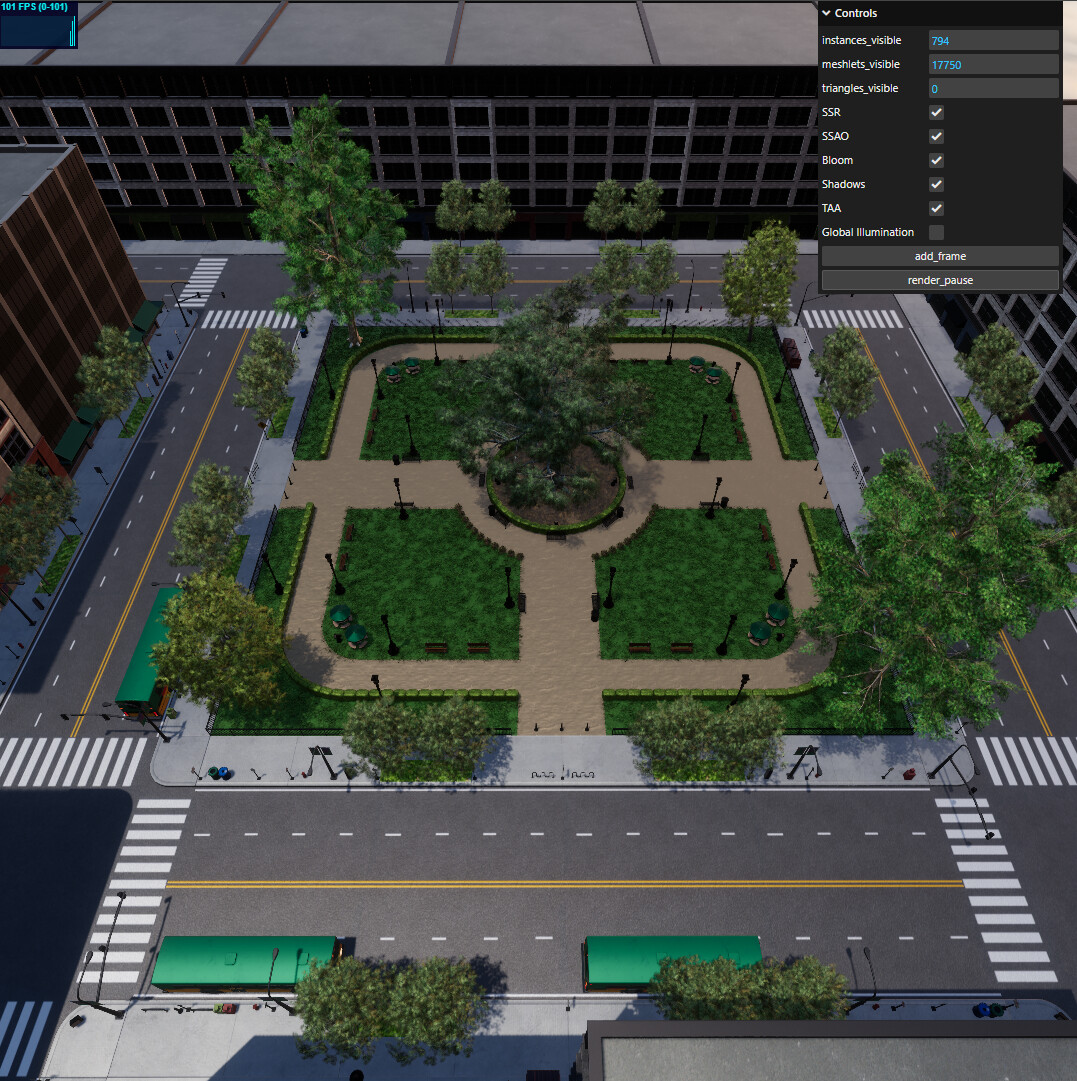
I implemented rasterization culling, where if a primitive (mesh/meshlet/triangle) would not span across any texel centers - they are culled. This reduced number of drwan primitives by ~5%, not as much as I had hoped, but still valuable. The code is very simple for that, so it’s an almost free win. I improved HZB culling for shadow atlas, there were a few bugs resulting in overly conservative checks, this gave the biggest benefit with ~20% reduction in surviving primitives. Finally, I overhauled culling for meshlets which now happens in fewer dispatches and has pretty much all filters I have turned on. The perf on the scene has increased from ~72 FPS to ~101. It’s not all shadows, as the culling code is uniform for shadows and main view. But Shadows contribute the most in terms of time on this scene. That’s about 40% uplift in performance, pretty happy about that.
I rewrote large parts of the meshlet management code, the meshlets are now carrying the full geometry data.
It’s somewhat ironic, because I started with this more than a year ago, and ditched it for the sake of performance, and now I came back full circle.
The reason I ditched it was because I had extra de-referencing stages in the pipeline and had to carry extra GPU buffers, but now a year later I have better memory-management code and I have fully embraced treating gpu buffers as uniform data instead of structured data.
For those that might be interested, I was inspired by Ubisoft presentation on Rainbow 6 Siege, where they talk about encoding all kinds of data into uniform buffers of vec4u. There’s a more recent presentation of this for Assassin’s Creed Shadows, where they basically build on that technique and explain it in a bit more depth.
Alan Wake 2 guys had good success with meshlet compression, before them Unreal guys presented meshlet compression in their Nanite talk at SIGGRAPH.
And most recently, I saw a presentation by Capcom on their “RE Engine” ( https://www.youtube.com/watch?v=nWgPtCDXlPc )
Where they talk about meshlet compression. I actually really liked that last talk, because the compression scheme they present is very simple and robust. So I went ahead an implemented something similar.
I know that numbers can be very hand-wavy, but as an example, on a very geometry-heavy scene used for testing called “Powerplant”
I was able to reduce geometry memory usage from 624,274,722 bytes down to 288,353,500, that’s 54% savings.
The way it’s done is not very complicated, normals and tangents are encoded to u32s using octahedral encoding with a few bells and whistles.
The other side of this is a sort of run-length encoding. Let’s take color attribute on a meshlet. And let’s say that all of the vertices in the meshlet are the same color - we can skip storing values for all vertices and just write one value instead. Same for flat meshlets and their normals, same for untextures meshlets and their UVs etc. It works really well.
As for indices, a meshlet in Shade is limited to 256 vertices, so indices are stored as 8u, it takes a bit of effort to pack and unpack them, but it’s not hard and you claw back close to 75% of space for indices, compared to using u32. Not exactly 75% for various reasons, but close.
One thing I don’t do currently is position quantization. I want to do that in the future, but mechanics of doing that without creating cracks are a little complicated. This is something that can offer the most in terms of savings though, so I will definitely be doing it in the future.
Lastly, I do a little bit of GPU cache optimization on individual meshlets by rearranging the vertices. On my GPU it yields about 1% performance uplift, but hey - free performance.
If anyone is curious, here’s what meshlets look like
Here’s Sponza
And just instances