Hi, I’m building a POC for building construction use case. Due to the characteristics of our model, I think I’m hitting a performance dead end here and wanted to check if I have correct understanding on the problem and if others have overcome similar challenges; otherwise, I might have to search for other approaches.
I can’t share the model, so here are some details on the model I’m trying to render
30000+ objects in glb of size ~50mb, even larger ones are expected
~7,000,000 vertices, ~5,000,000 triangles
Scene tree is flatten as much as possible (hierarchy might imply business logics)
Most objects must be independently selectable
Mesh.matrixWorldAutoUpdate set to false after loaded
No textures, only plain material using MeshStandardMaterial and has removed duplicates.
Rendering at roughly 30 fps (based on Chrome’s frame rendering stat)
I am testing on an i9 gen13, Nvidia RTX 4060, 40G RAM laptop, but users usually won’t have laptops at this level, so I’m trying to optimize the performance.
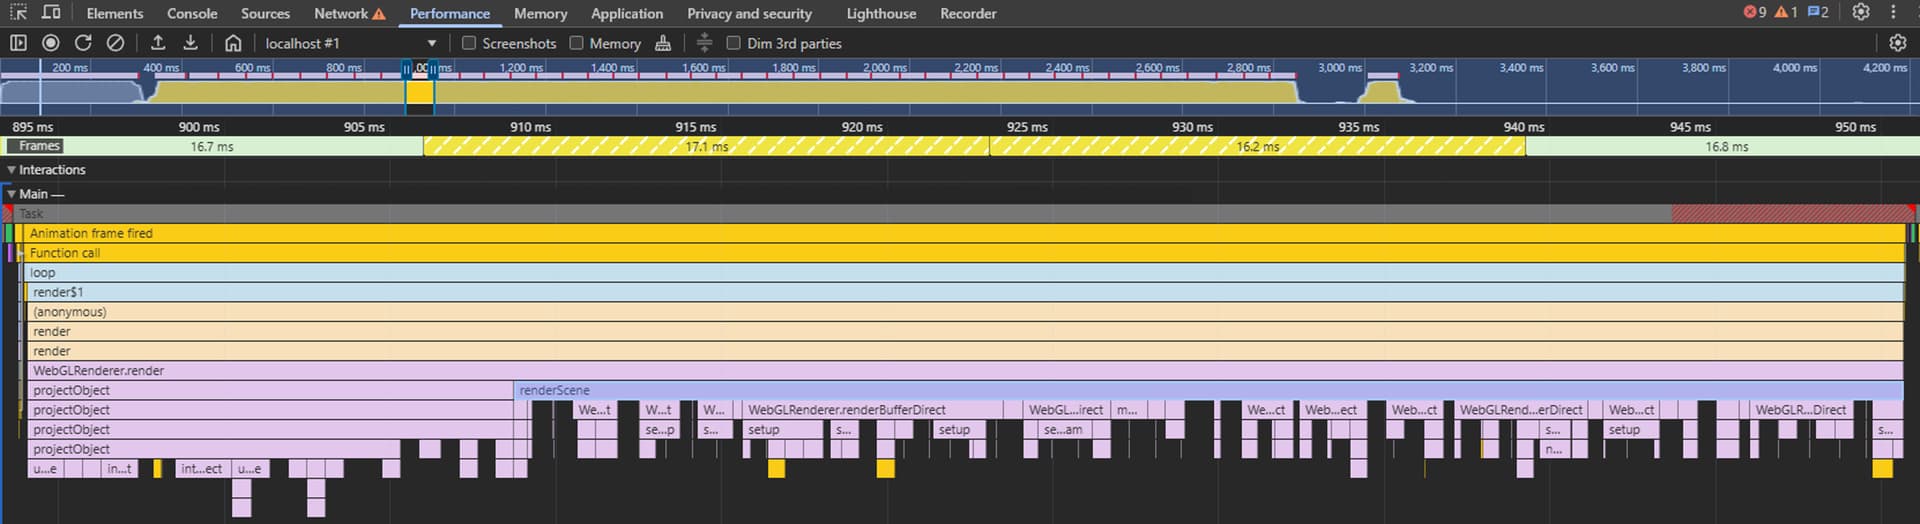
I tried to benchmark it with chrome’s performance devtool and the the detail of a single frame while rotating with the OrbitController is as shown below.
Based on the devtool, is it correct that my bottleneck is CPU-bound (such as long running projectObject function) instead of GPU-bound ?
Devtool result seems to represent draw call with green block, is it expected for draw call task taking such short time given the amount of objects? shouldn’t draw call amount be proportional to the object amount?
If the vertices/triangle amount can’t be changed from source modeling software, are there any other approaches/workflows to improve performance without removing the modeling details?
From what you describe, you’re likely drawcall bound… which isn’t quite cpu or gpu bound, but bound by the synchronization between the two.
You’ll probably need to use techniques like merging/batching/instancing to overcome this.
regarding the business requirements of hierarchy/selectability.. it might be useful to separate the mindset of what you render, vs your scene description/what you interact with. They don’t need to be the same thing.
You can merge all the geometry into one large geometry, and render it in one drawcall, but still maintain a separate spatial indexing scheme like a bvh or similar, to accelerate interaction with the underlying components.
When interaction happens, you can edit the merged representation, or regenerate it from the data model after an edit.
Rough ballpark figures for the 2 main bottlenecks:
triangles ~16 million for high end cards. ~2million low end.
drawcalls: ~2000 per frame for high end cpu+gpu combo, ~500 or less, for low end.
so..
I would suggest merging/flattening the hierarchy/merging geometries to solve the rendering bottlenecks, and then using an acceleration structure like mesh-bvh for interacting with the underlying model.
Addressing your bullet points:
yes. it looks like you are cpu bound. You wont know if its GPU bound until you unbottleneck drawcalls.
The green block is not really an accurate measure of GPU cost.. only the drawcall submission.. and its not entirely clear to me what it measures. (i only learned this recently..)
As sensei @manthrax said, I recommend using BatchedMesh to reduce drawCalls, and if you want something more advanced you could also use this library to speed up raycasting and frustum culling using a bvh, and if necessary also create LODs on the more complex geometries.
That seems like a very low estimate to me. Without having a source at hand, I’d say from experience that the numbers are up to one order of magnitude higher for high-end rigs, and considerably higher for low-end, depending on how you define “low-end.”
Maybe it’s also worth mentioning that the WebGL extension required to take full advantage of BatchedMesh is not available in Firefox. You can use BatchedMesh but it will use a slower fallback in Firefox (and possibly other “niche” browsers as well).