I’m starting with two teaser images, to get you curious enough to read this till you arriv at my questions at the end:
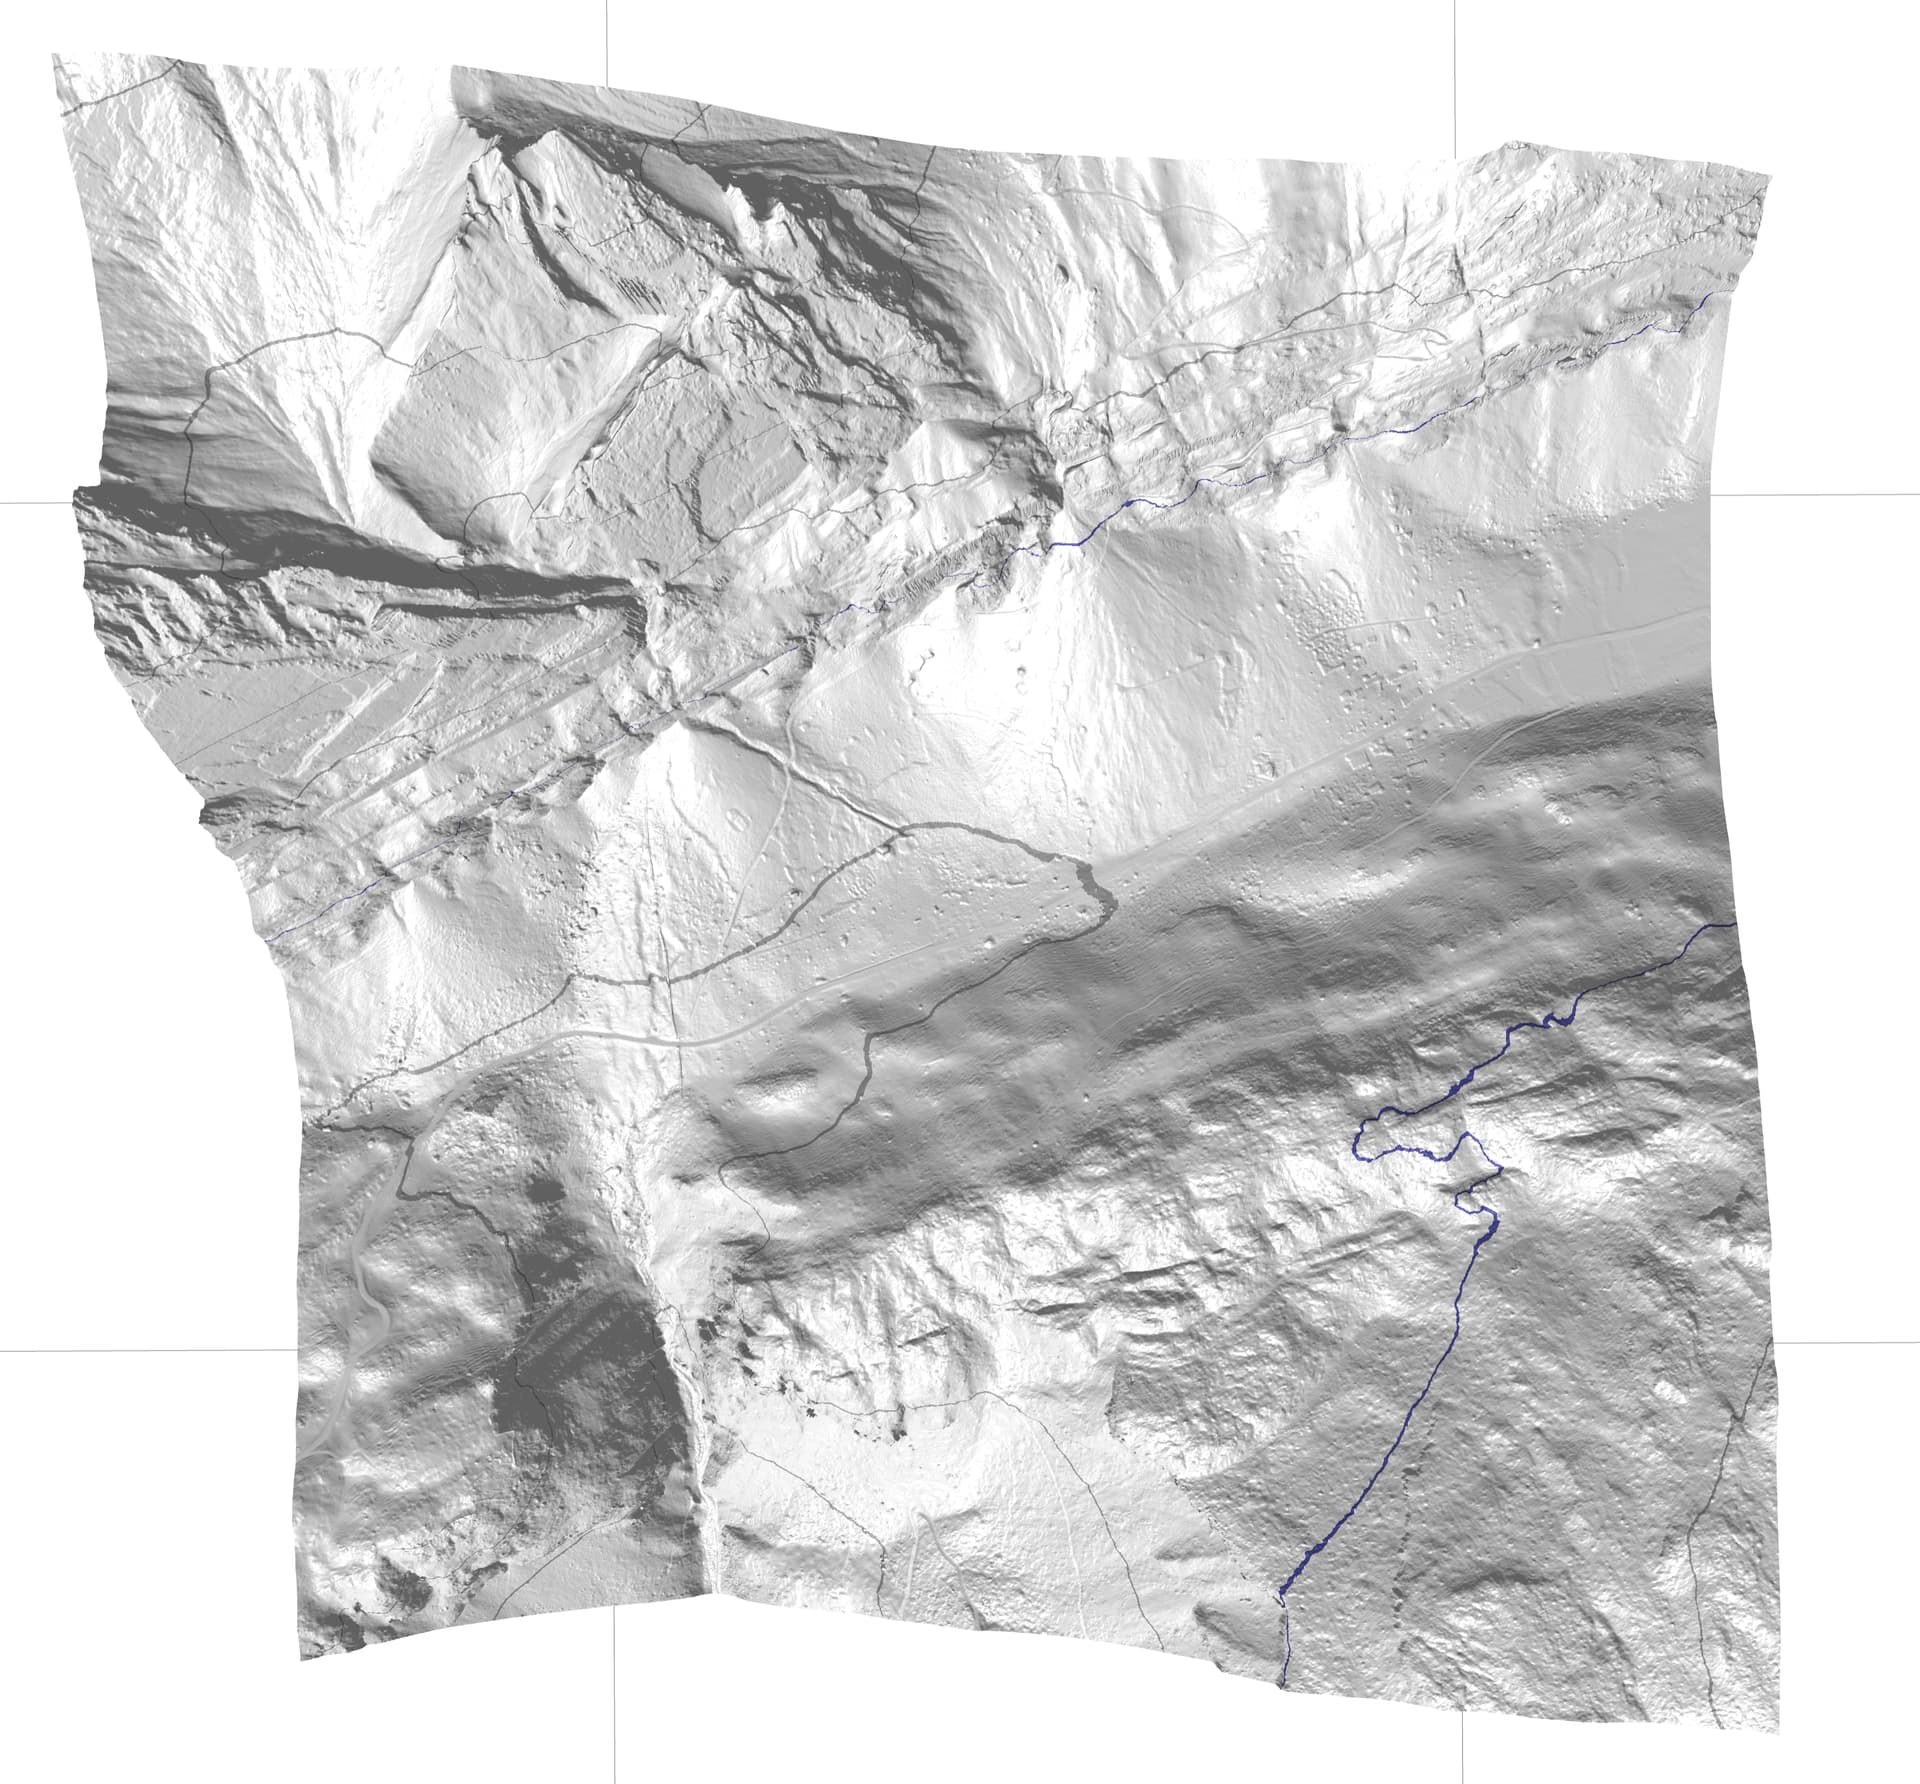
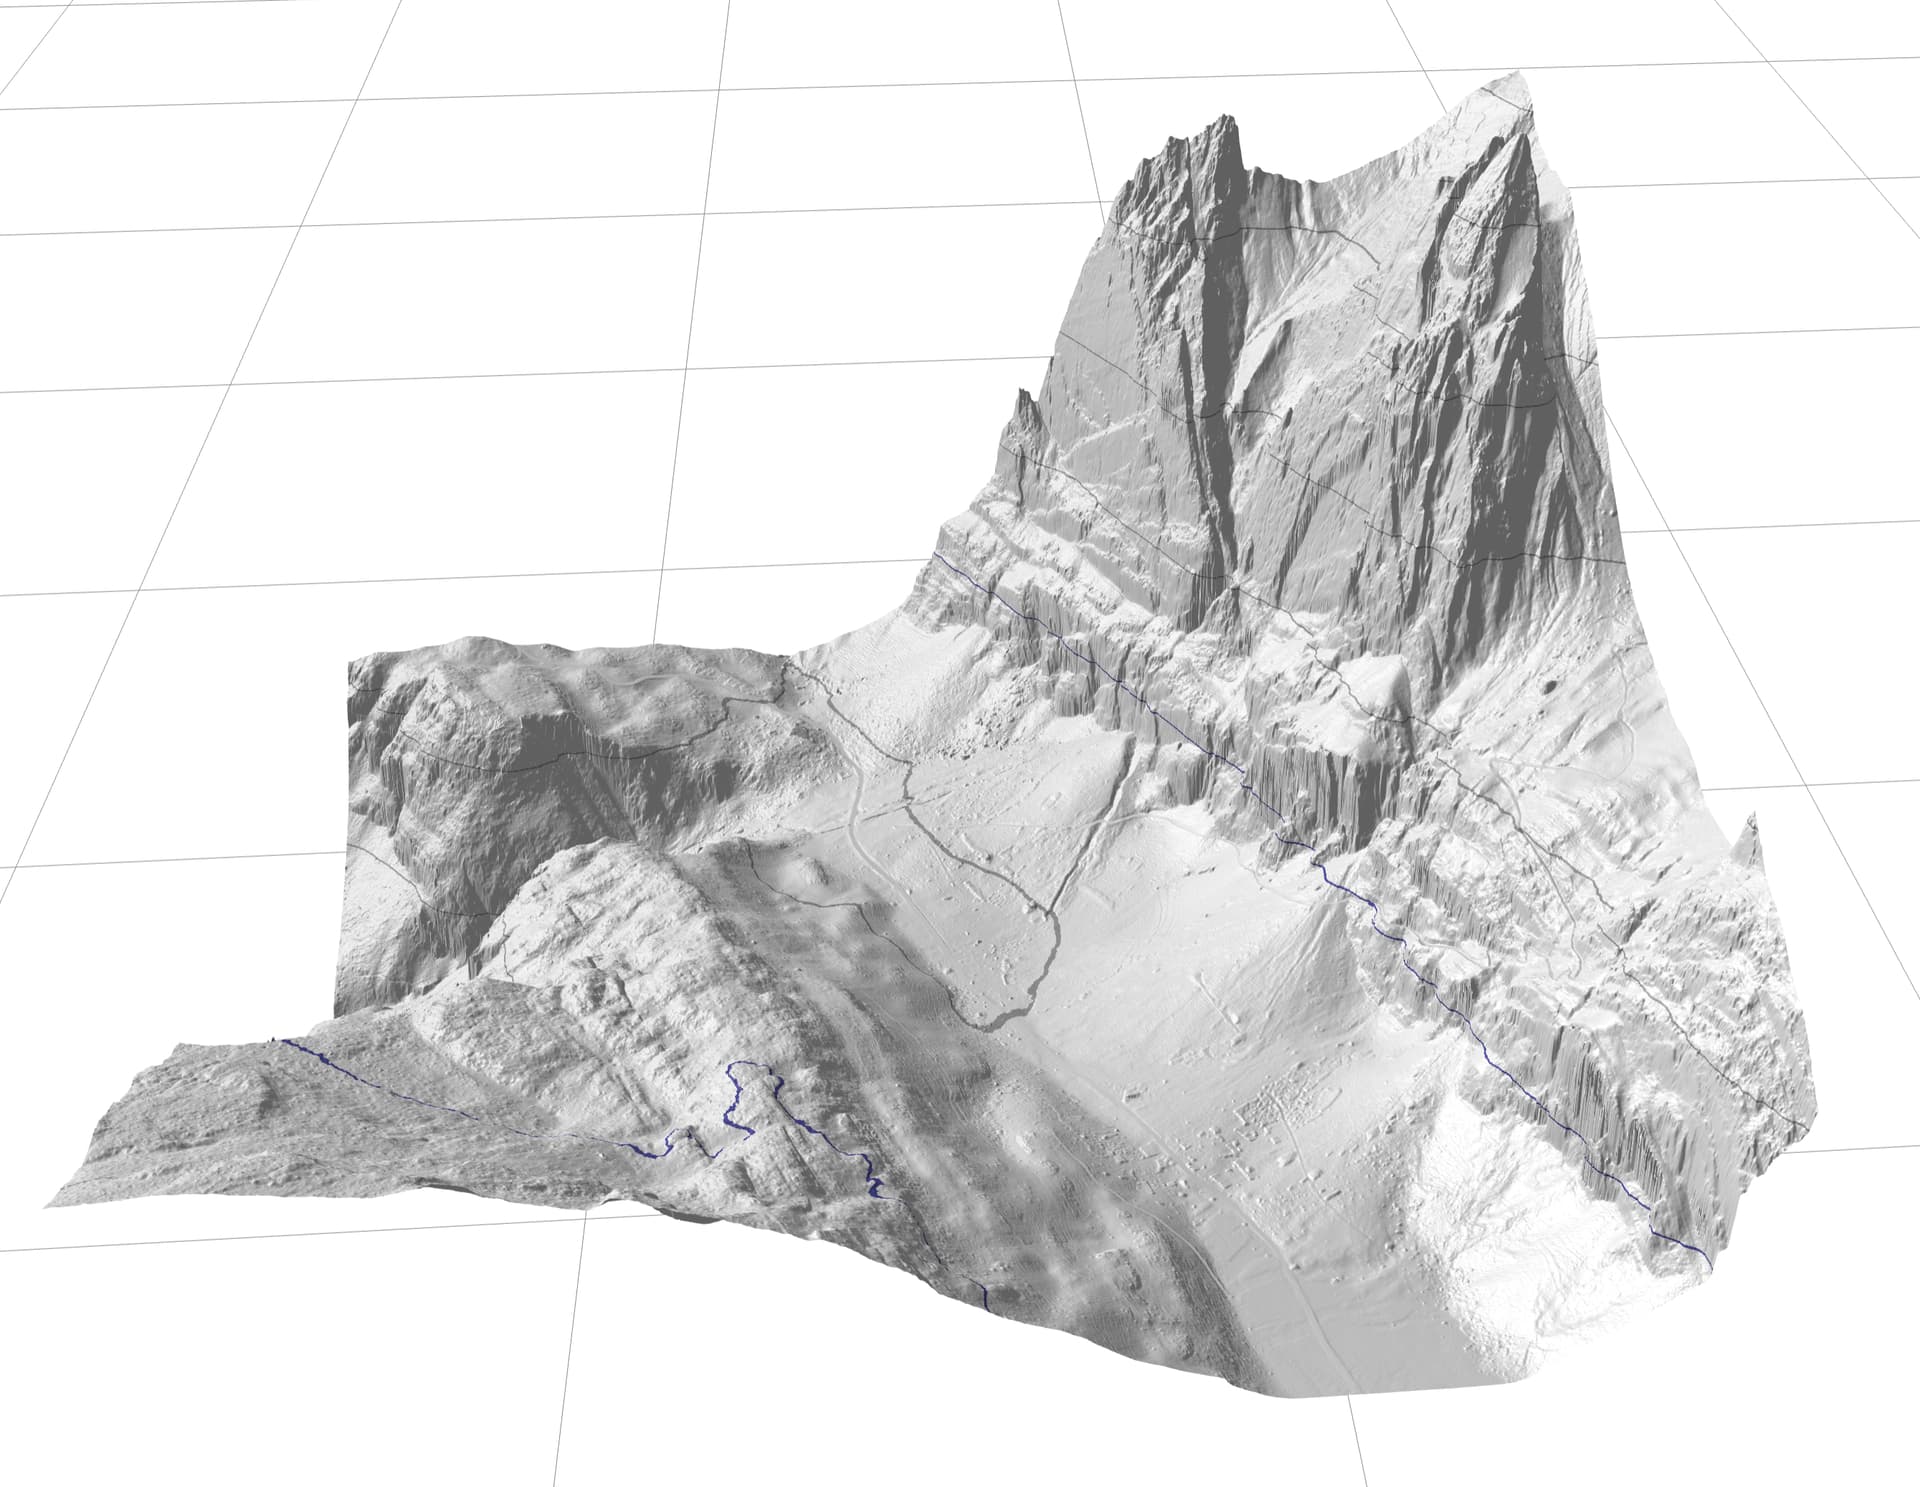
This is the 3D-rendering (elevation only) of a 1 by 1 km patch of a north-eastern part of the swiss alps, bird’s eye view:
… and from a different perspective:
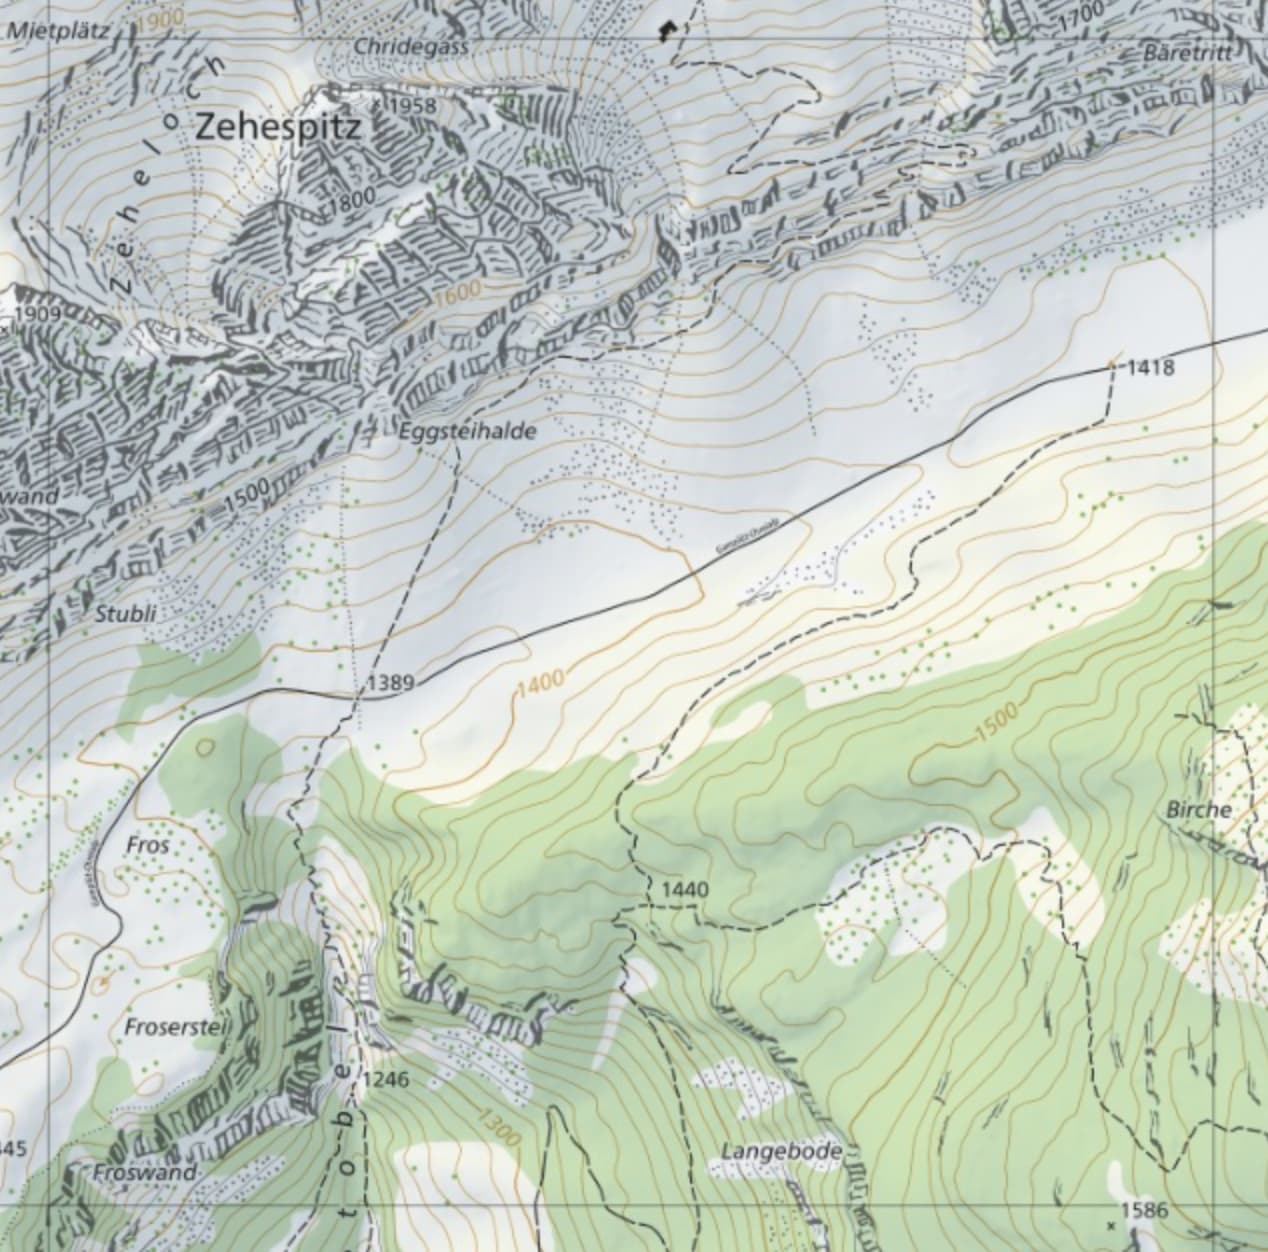
And this is the same patch as shown on the official 2D topographical map of Switzerland:
A Swiss government website makes high-resolution digital terrain elevation data available free of charge.
The data can be downloaded as tiles covering a patch of 1 km by 1 km each. In its highest resolution there is one data point every 0.5 meters in both dimensions, placed at an evenly spaced grid. After downloading (as .zip) and unzipping, each tile’s data consumes 124 MB on disk.
That gives you 2000 by 2000 = 4 million data points per tile.
When filling Three.js data structures (a PlaneGeometry), for each data point I need
- 3 position components,
- 3 normal components and
- 2 uv components
so that’s 8 Float32Array values which is 32 Bytes per datapoint, or 128 MB per tile.
Since I’m not content with viewing 1 tile only (actually I’m aiming at approx. 80 tiles simultaneously), the combined storage requirements significantly overflow the 4GB of my iMac’s graphics adapter, as I did expect. To make rendering easier on the GPU I implemented a 5-level LOD per tile, which increases the memory consumption per tile to approx. four thirds of the initial storage requirement. This brings me to approx 170 MB / tile. At 80 tiles this would naïvely require 13.6 GB, which my late 2014 iMac equipped with 32 GB of RAM should be able to handle.
But earlier than expected I’m seeing this in the console:

Apparently I’m exhausting the physical memory of 32 GB: the macOS ActivityMonitor, “Memory” tab shows this (filtered for “Chrome”), 1 tab only:
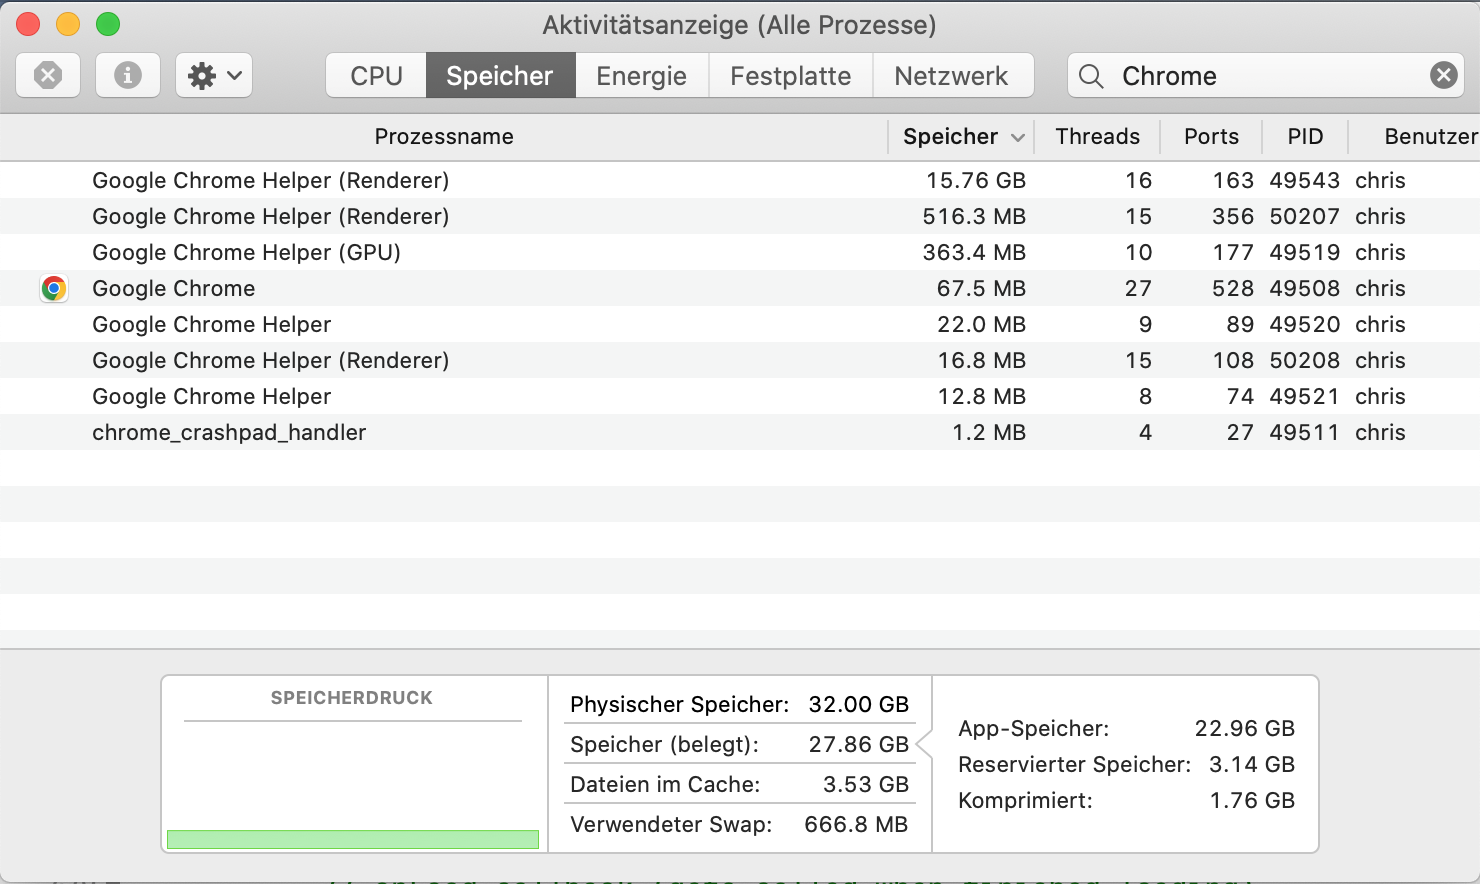
Looking at the visual result I conclude, that 55 tiles did load correctly:

Now I’m wondering:
The top consumer “Google Chrome Helper (Renderer)” swallows 15.76 GB for 55 tiles, that’s approx. 285 MB / tile, much more than the approx. 170 MB / tile I was naïvely expecting.
Now my questions:
- Did I miss some inherent (systematic) Three.js memory consumption?
- I’m using the
THREE.FileLoader()withsetResponseType( "text" ). Does the “data” buffer of the.onLoad( data )callback get freed automatically, once the callback finishes? Can I force / speed this up somehow? - does Three.js support some kind of a “packed” data format for storage (not: loading)?
- is there any other way how I could assist host-side garbage collection without losing data I need to keep?