So i did a lot of work to optimize my rendering, and it runs really fast, until it doesnt.
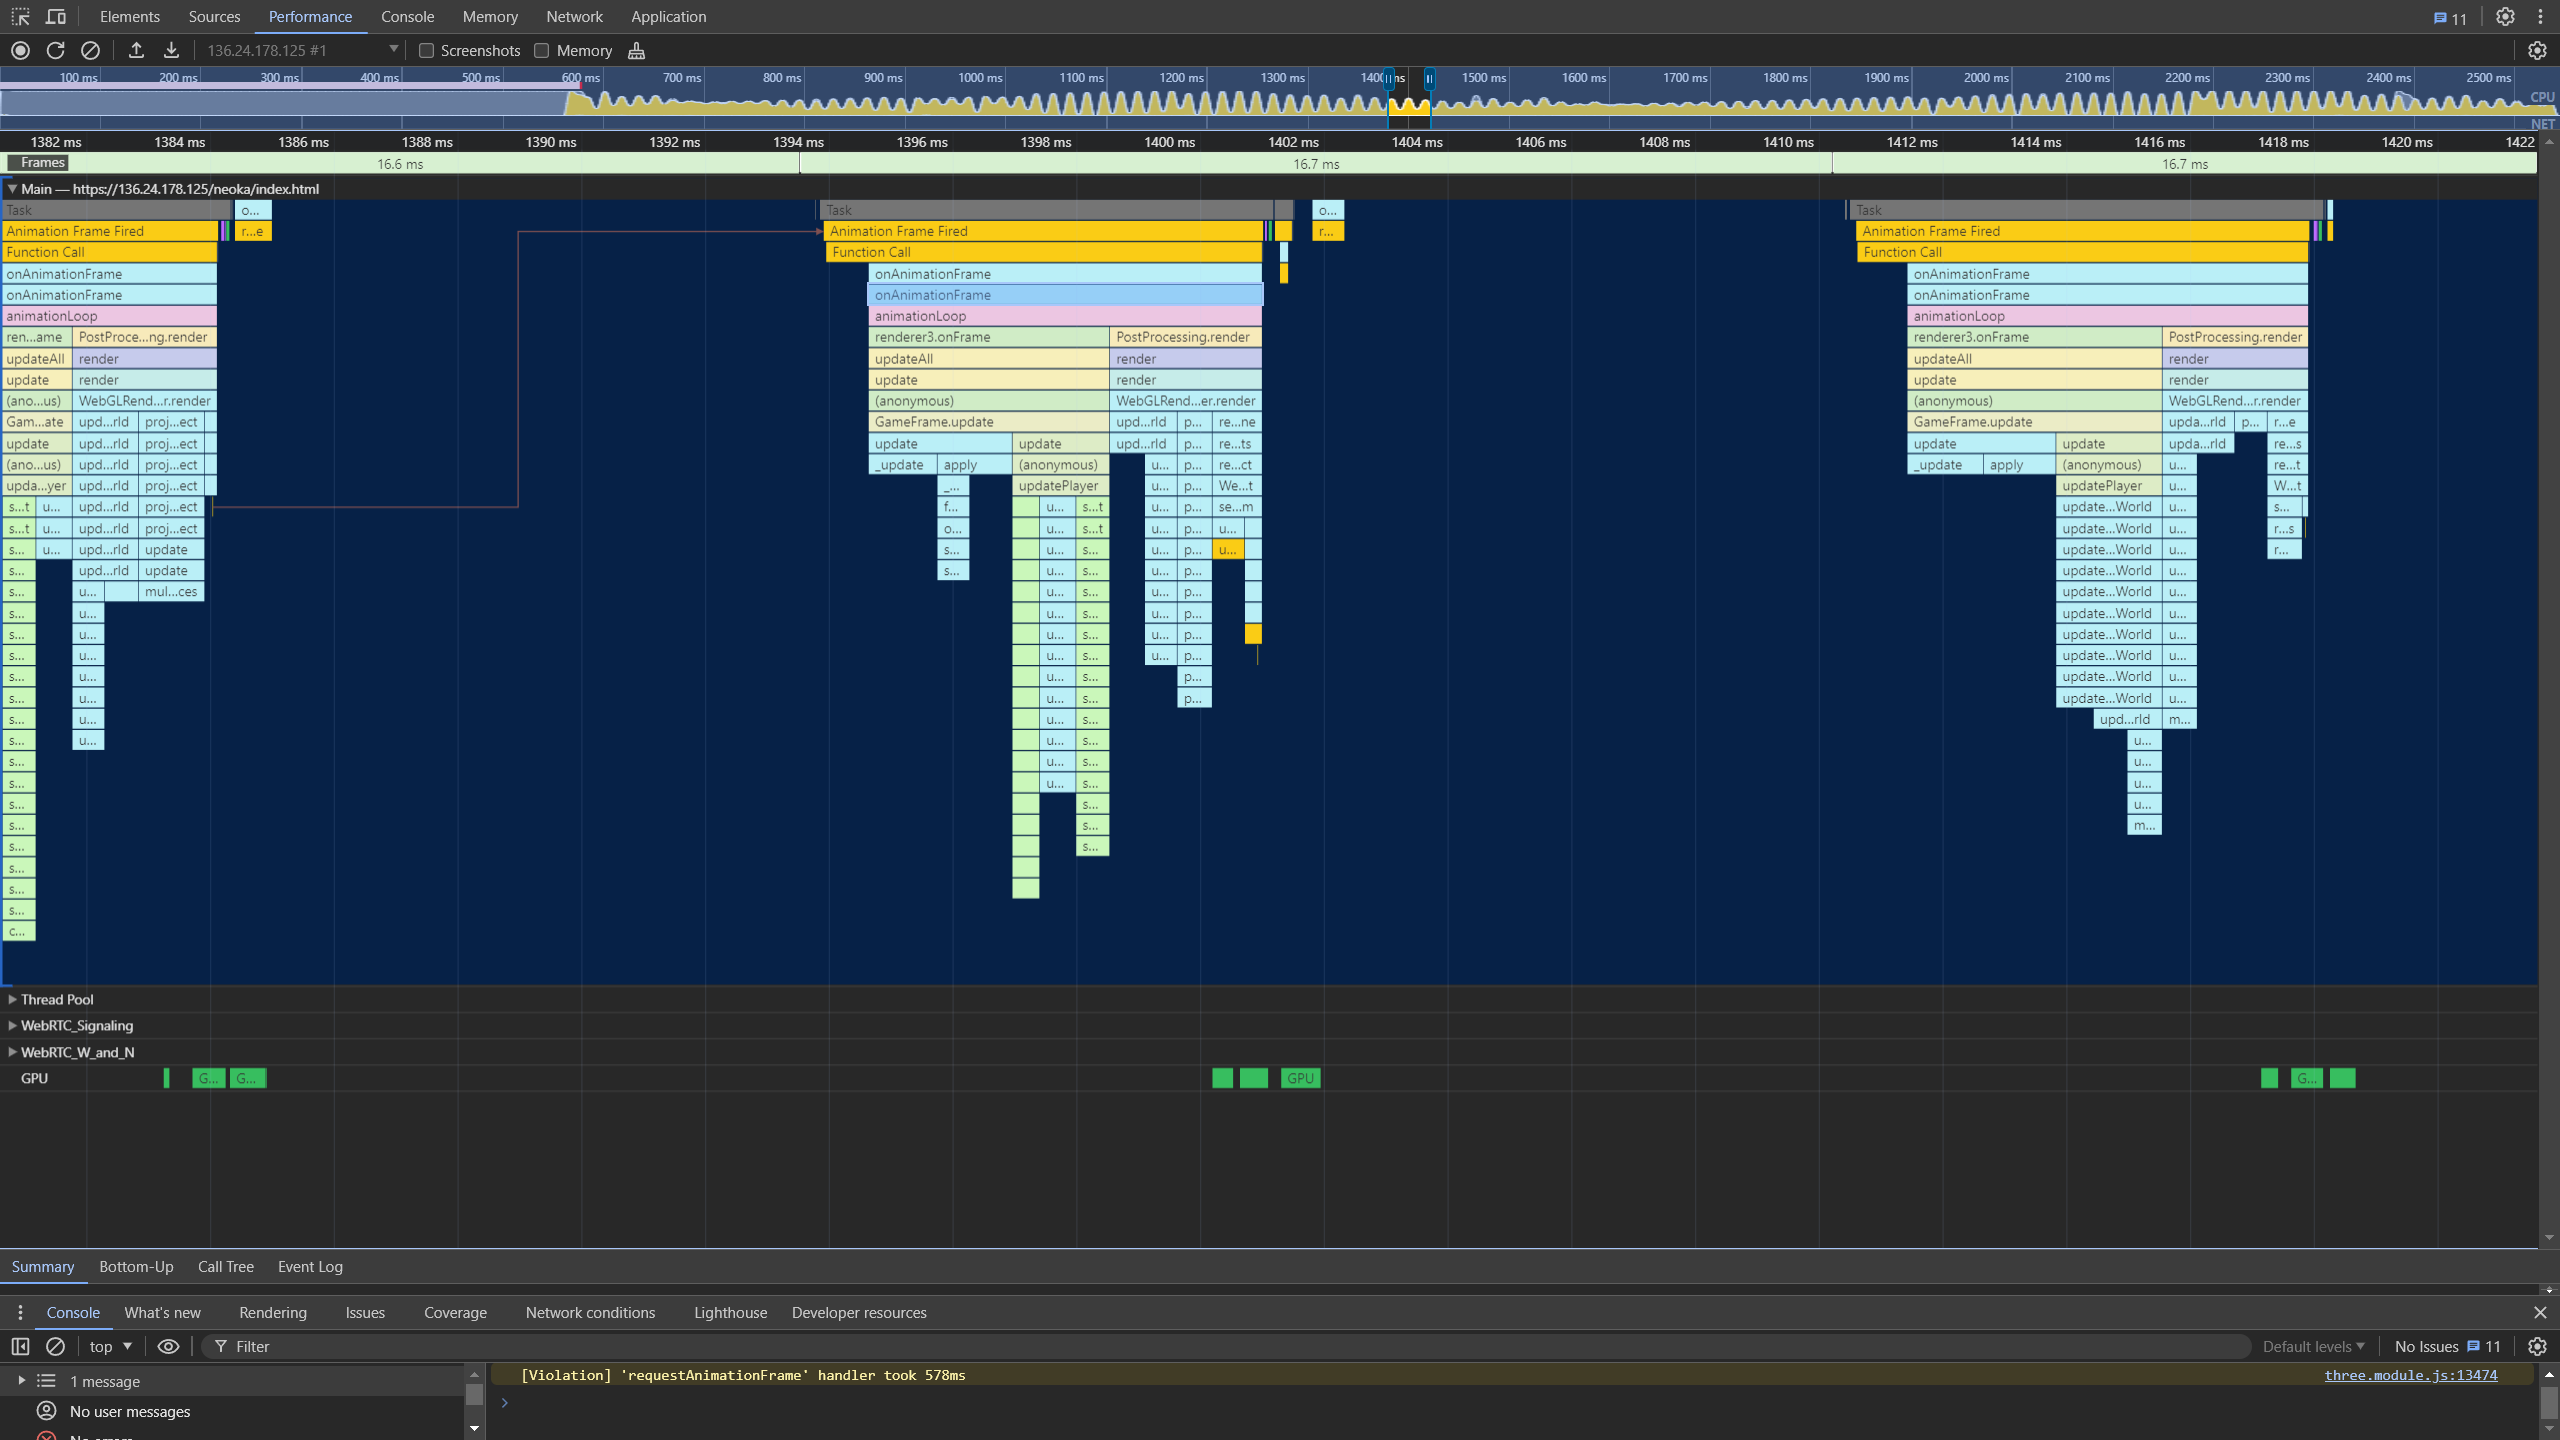
When i profile it looks like this:
From what i can tell, my code executes fast, but there are all these dropped frames. I’m on a mac.
So i did a lot of work to optimize my rendering, and it runs really fast, until it doesnt.
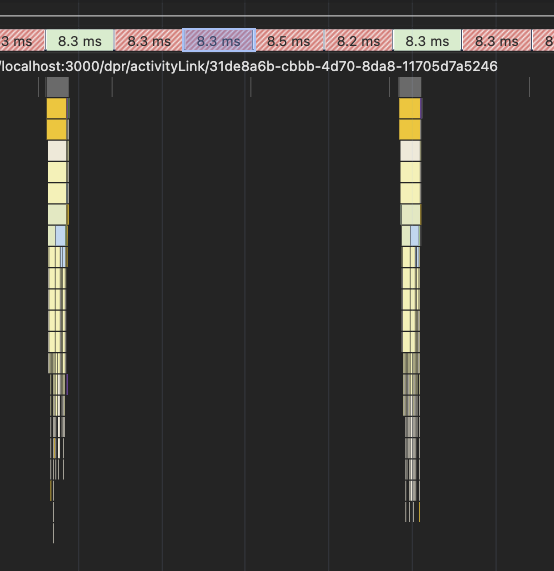
When i profile it looks like this:
From what i can tell, my code executes fast, but there are all these dropped frames. I’m on a mac.
if you scroll further down, does it show the green bar for GPU utilization?
Do you have any other tabs open with webGL stuff in them?