Hey guys. How are you doing?
Well, I’m following the saga of this 3d graphic that I’m trying to draw, along with that I’m learning a little more than three.js each time.
I’m stuck now on the issue of grids of coordinates, I’m using gridHelper, would this be the best alternative?
I imagine there could be something easier, as I’m not managing to adapt the grid very well to what I need. This is the code I have:
function createAGrid(opts) {
    var gridXZ = new THREE.GridHelper(250, 6)
    gridXZ.scale.set(1, 0.5, 0.25);
    scene.add(gridXZ);

    var gridXY = new THREE.GridHelper(250, 6);
    gridXY.position.z = -31, 25
    gridXY.position.y = 125
    gridXY.rotation.x = Math.PI / 2;
    scene.add(gridXY);

    var gridYZ = new THREE.GridHelper(250, 3);
    gridYZ.position.x = -125
    gridYZ.position.y = 125
    gridYZ.rotation.z = Math.PI / 2;
    gridYZ.scale.set(1, 1, 0.25);
    scene.add(gridYZ);
}
Here is a live demo of my code:
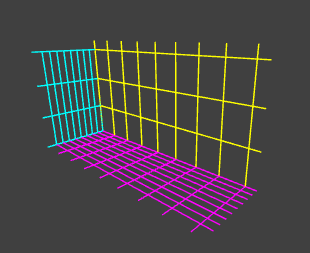
And this is what I’m trying to achieve:
This kind of grids
Is there any way that grids are not “square”, that is, with the same amount of rows and columns? I needed there in the back 3 rows and 10 columns, to correspond with the 10 measurements I have.
Likewise, I would like to have the bottom 6x10.
Another thing I can’t do is leave the grid lines corresponding to the 10 plotted measurements, they don’t look right on top.
And, a last point would be to check the possibility of extending some lines of the grid, according to the template I showed above that I would like to get it working.
Any help would be most welcome.


