Question about how to optimize performance for a mesh non-repeating heavy scene

Hi, I’m trying to use react-three-fiber to build a indoor configurator that takes params for each model’s url and transform info to layout the rooms. And since the models are random, I tried the following approaches to enhance performance.

Render side wise, I tried to:

  • use on demand rendering
  • disable shadowMap auto update, and only update mannually on model loaded/transformed
  • Only use 1 ambientLight and 1 DirectionalLight for casting shadow

I didn’t use instancing since none model will repeat themselves.

And I didn’t merge geometry of the meshes during runtime since I have heavy interaction for each model

On model side, I tried to use gltf-transform to:

  • resize texture
  • do ktx2 for texture
  • simplify geometries
  • join meshes
  • use custom texture atlas to merge textures

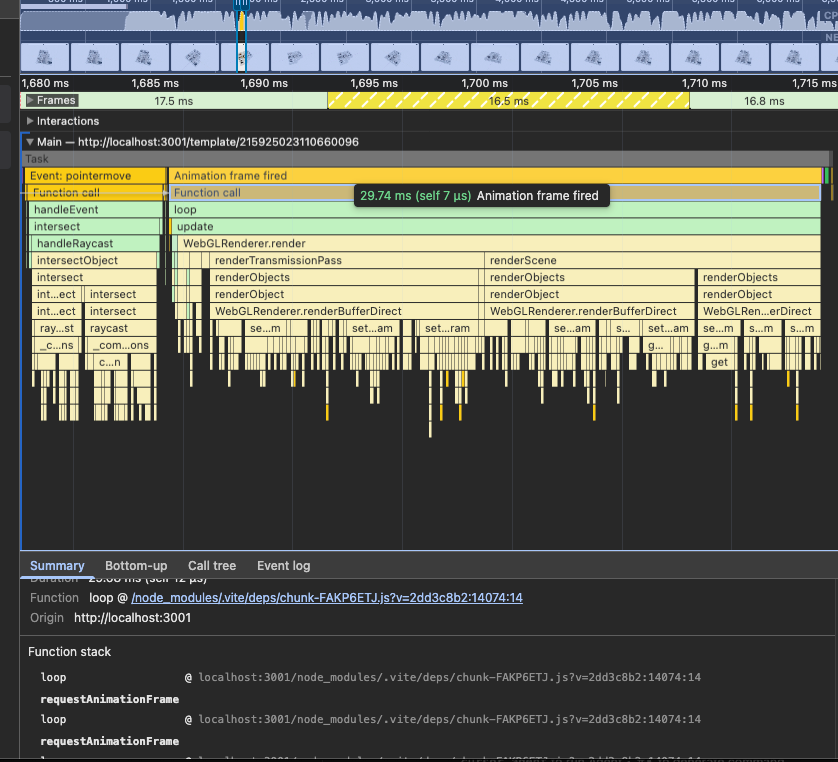
Yet, with all these approaches, for a scene with 164 models loaded, the fps is really low(below 20, sometimes even below 10). I wonder how I can further enhance the performance.

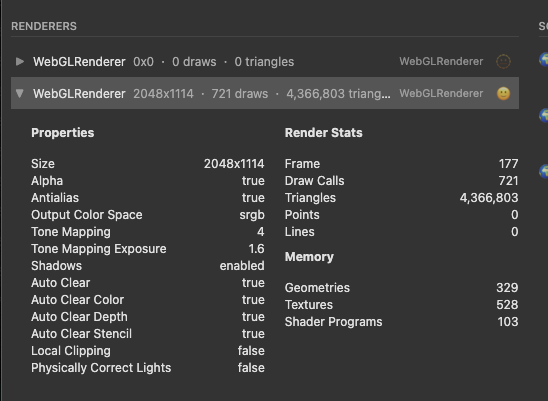
Here is the render info from three’s devtool

I know the drawcalls count is terrible, yet currently I failed to reduce it since I cannot do instancing, and I failed to merge the meshes in each model. I’ve considered do mesh merge during runtime, yet I succeed with mergegeometry, but failed with handling materials, also the need for interacting with each model and update their bvh makes it even harder.

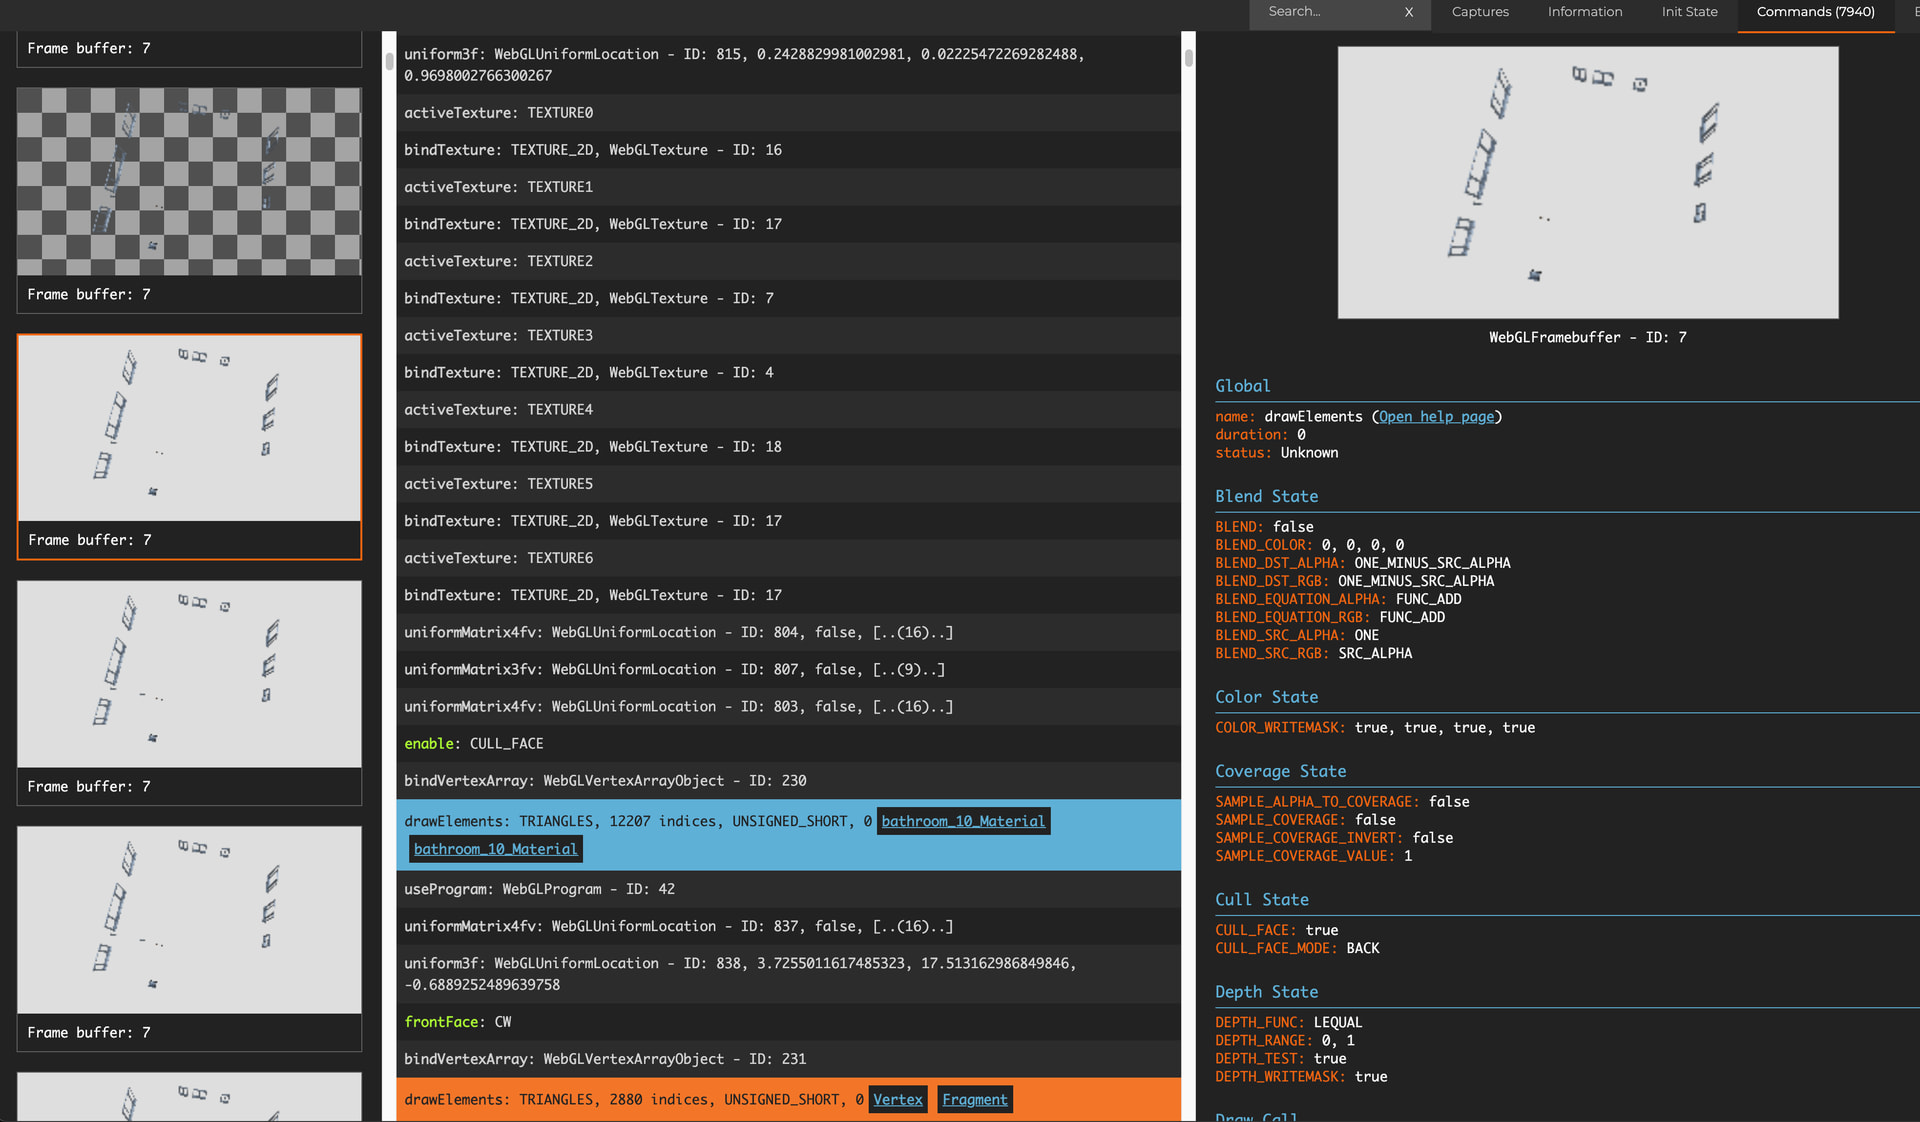
And there is a clue from inspector.js’ capture, sorry I failed to upload the whole capture file since it is too large:

First, the overview of the scene.

And by going through the commands, I found there seems to be two phases.

It starts with canvas frame buffer, but then frame buffer: 7. The frame buffer: 7 phase seems to be rendering all the meshes in the scene in dark color.

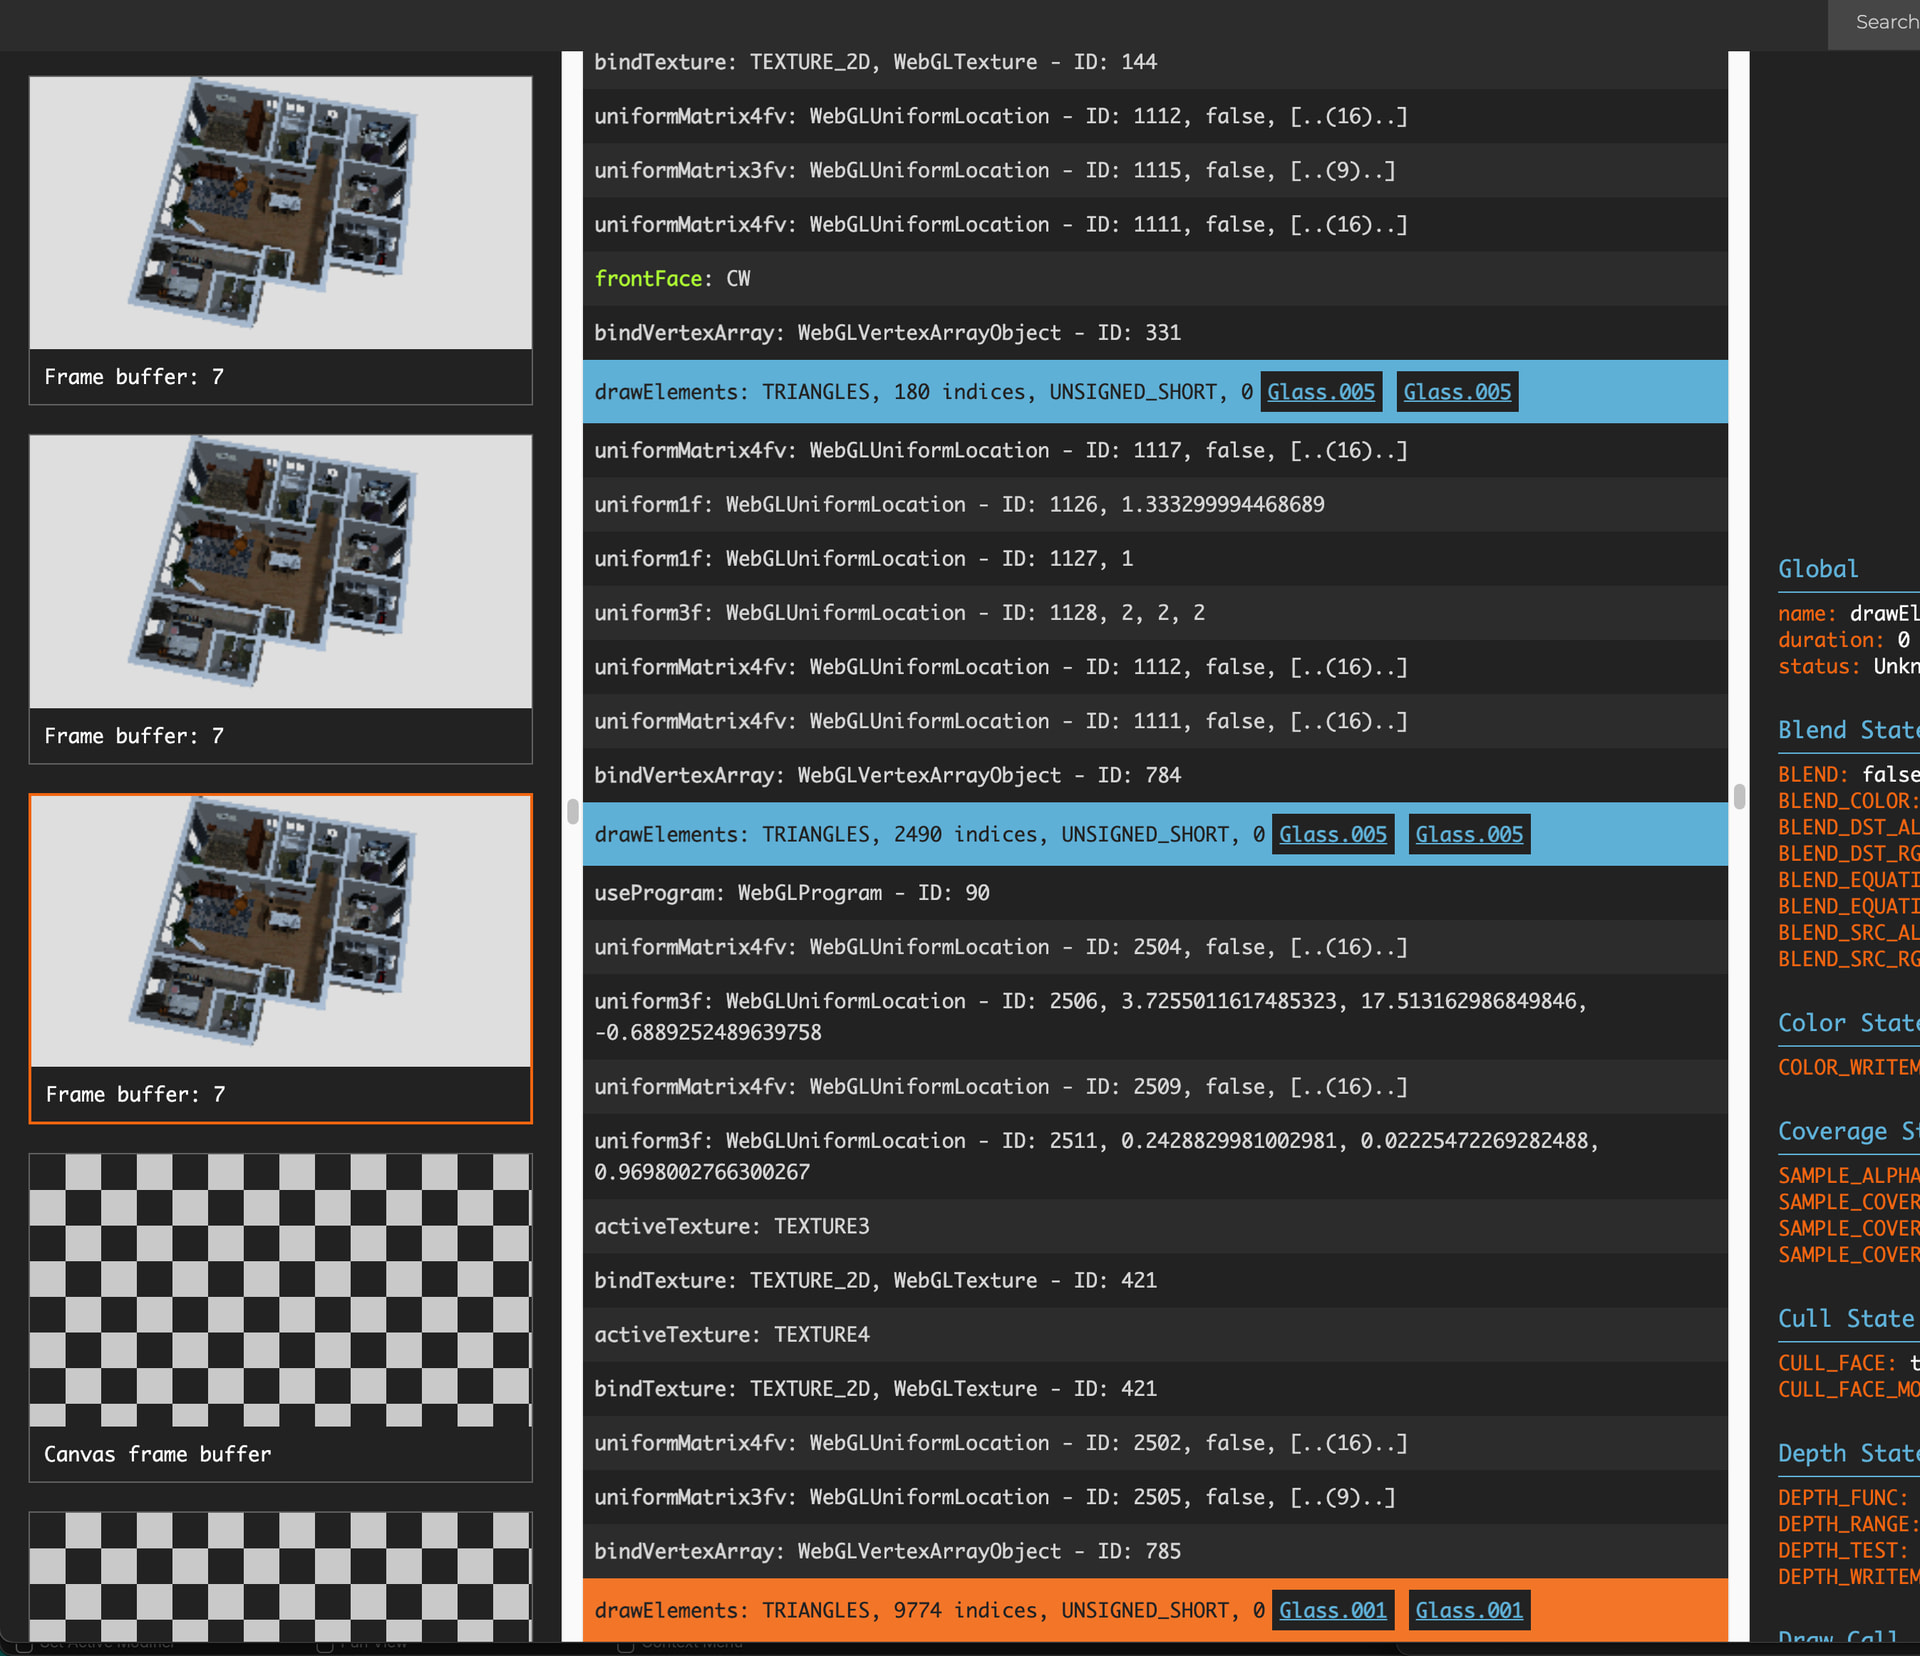
Then it switches to canvas frame buffer to render all the meshes again, but in lighter color, and the result is used for final displaying.

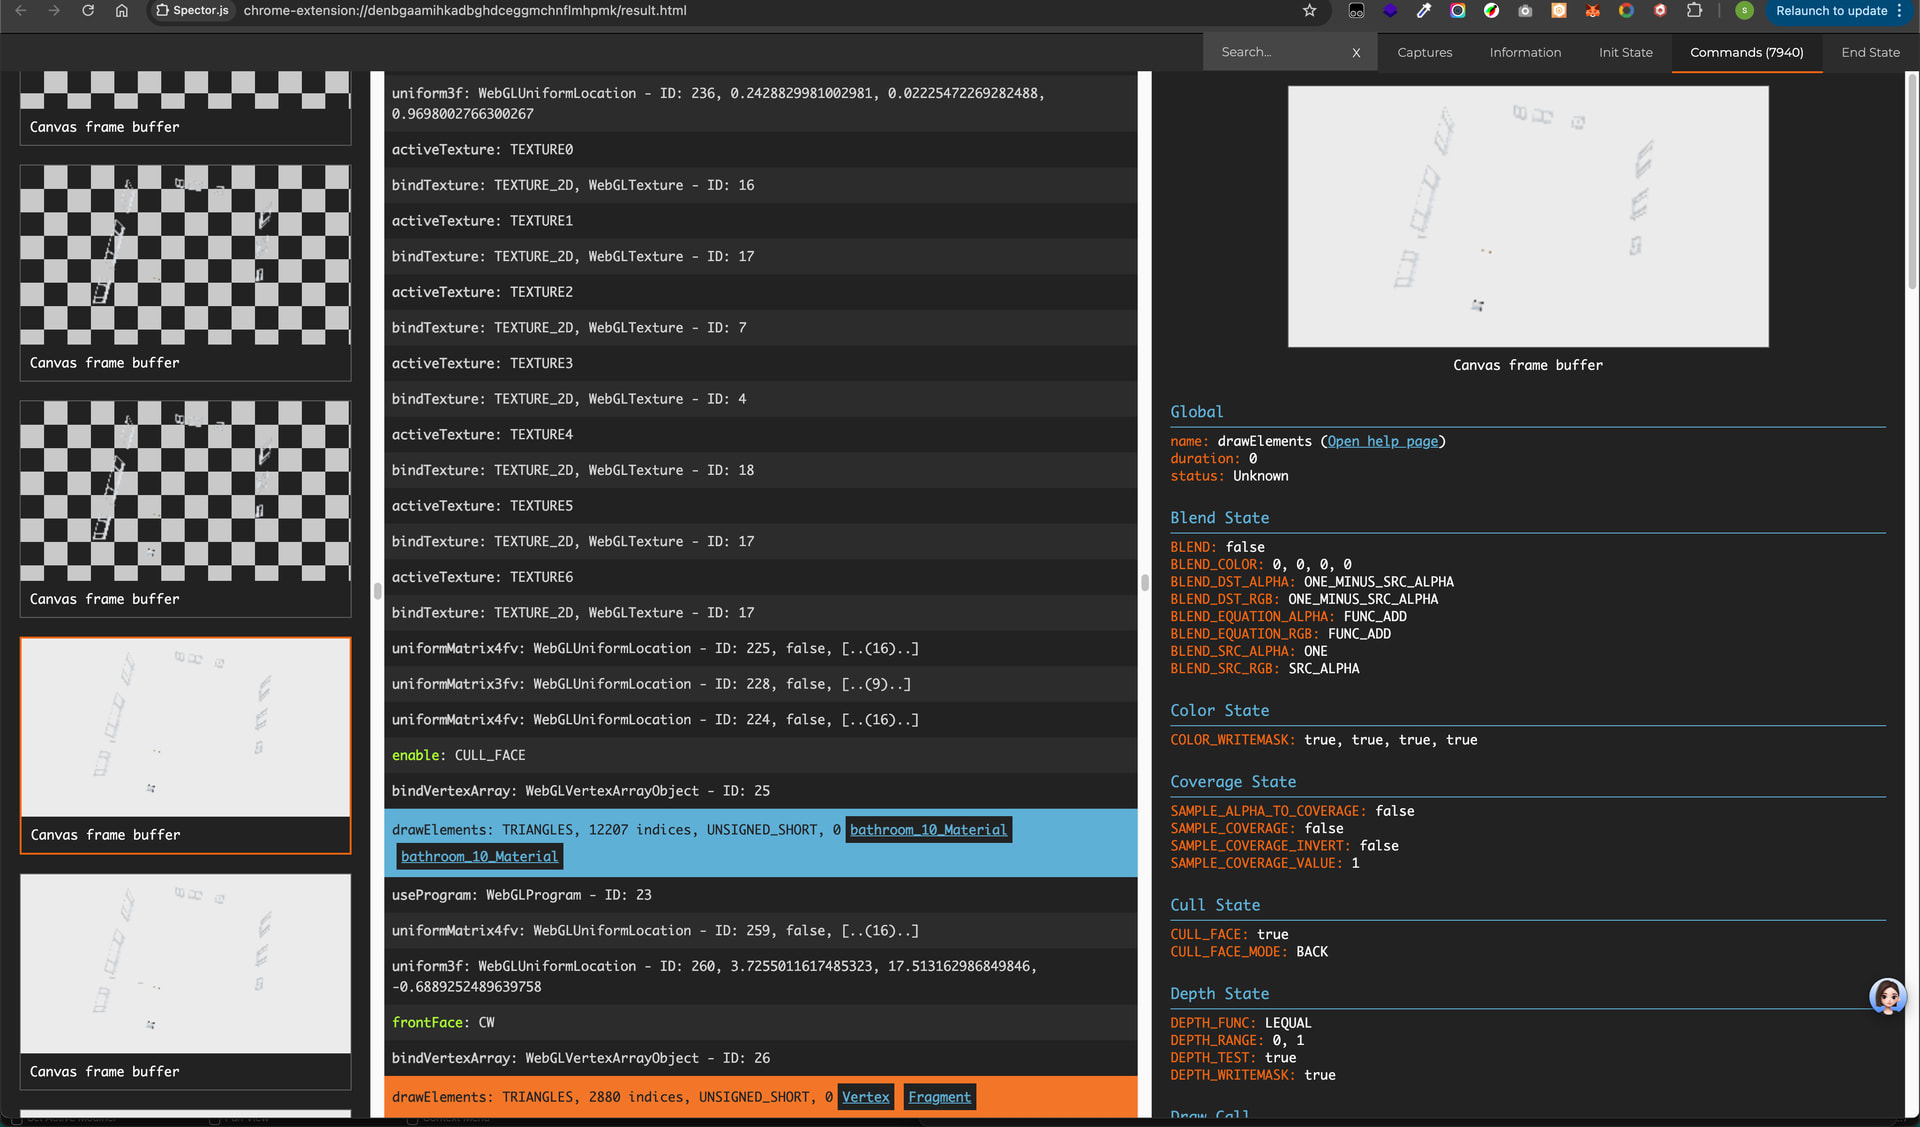
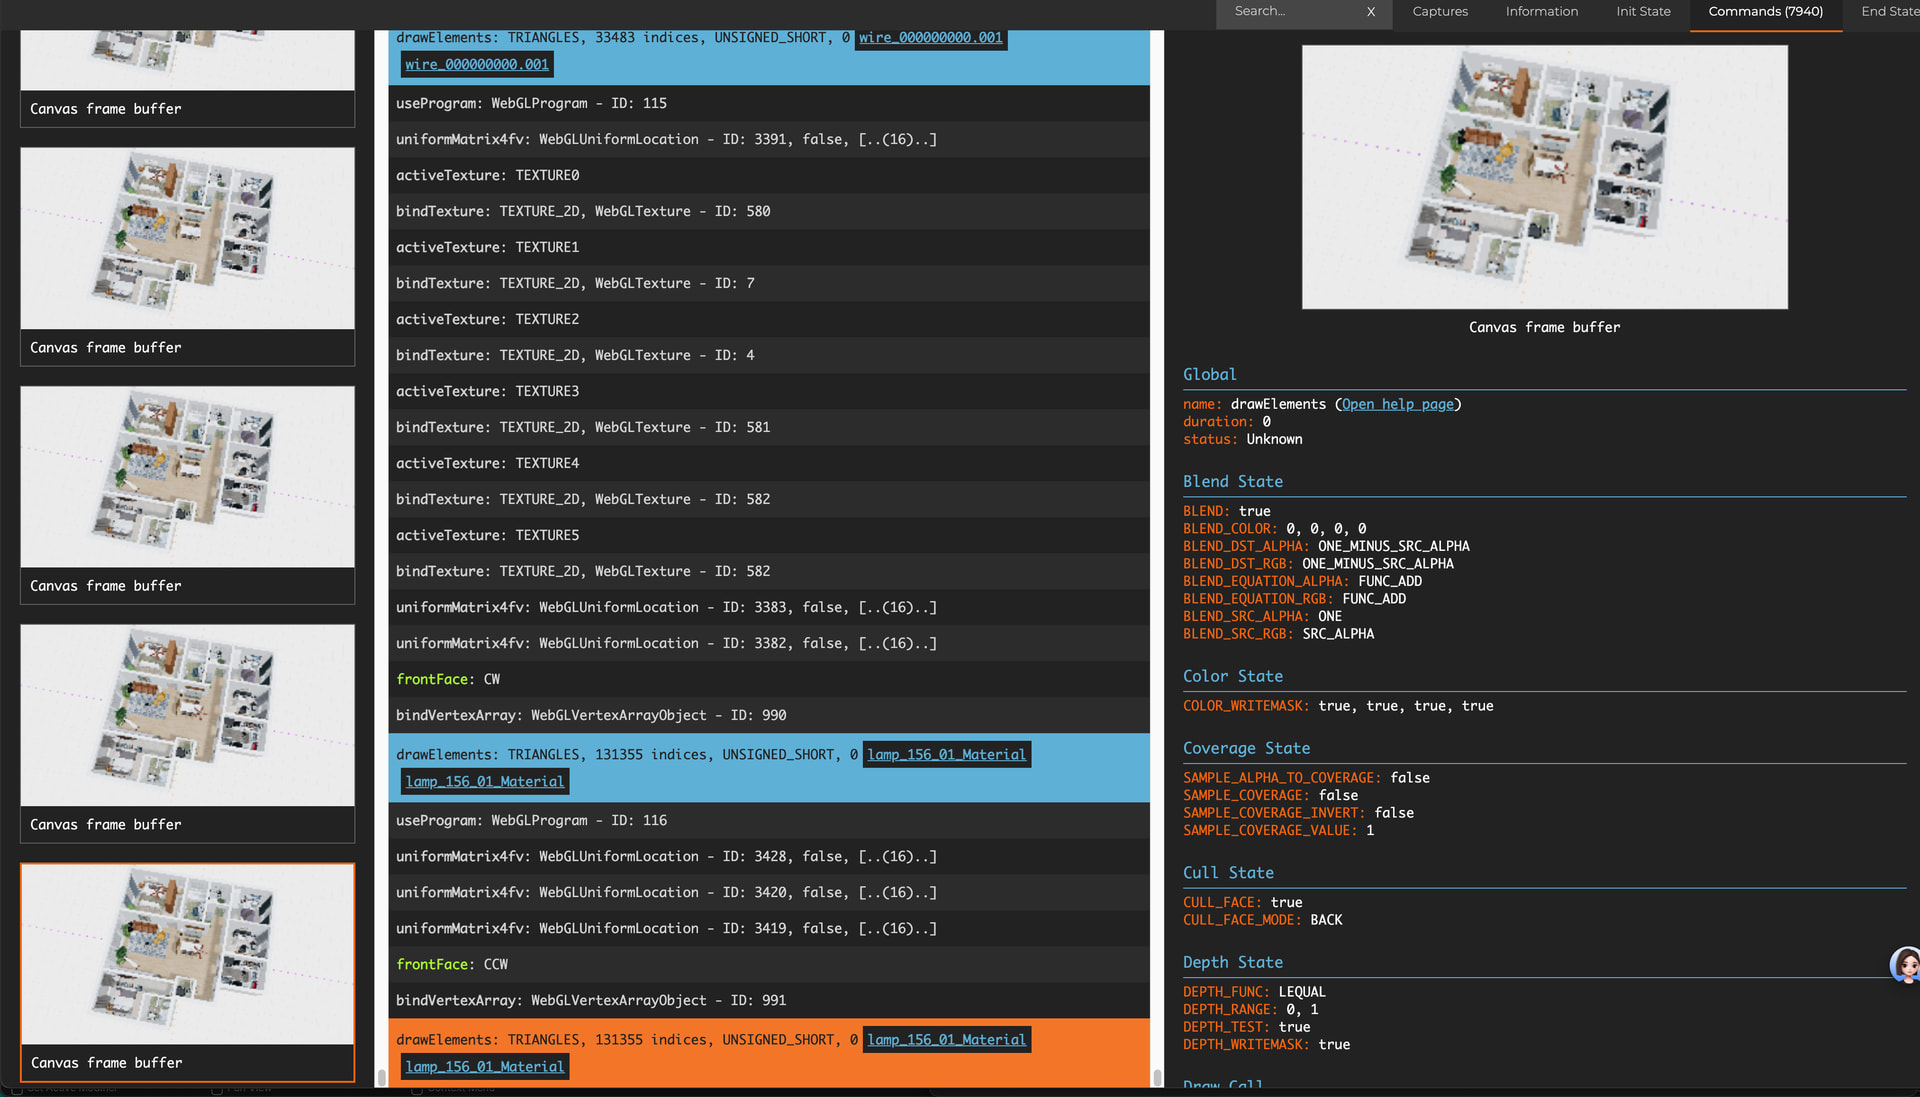
I wonder what’s the frame buffer: 7 phase for, why it renders the whole scene in dark color. And since it is taking almost half of the commands, Is it possible to get rid of it to make the render faster.

I failed to see the reason of this issue and wish someone can shed light on how to enhance the performance of this random over 100 unique models render case.

Thank you so much.

1 - Put a console.log(“test”) at the top of your hooks and components.

9 of out 10 times optimising r3f apps ends up being just improper state management and completely unrelated to the 3D part itself. Even without instancing, you should be easily able to render 100 models at 120fps.

In a healthy r3f app you should see no state updates / hook calls caused by the 3D world at all, and those outside of 3D world should avoid updating 3D world besides the affected parts - ie. changing floor color should not trigger entire 3D world to update and recalculate, smooth rendering should be in useFrame + useRefs, state updates should be shallow (example in zustand.)

Before even considering degrading render and texture quality in r3f, it’s always a good idea to first check devtools Performance tab and make sure there’s 101% nothing you can optimise on the CPU side first.

2 - 721 draw calls is a bit much, so after optimising react itself, optimise that.

First, I’d try to figure out why there’s 700 draw calls (ie. 700 separate things are being rendered) if you mention only 100 models :man_bowing:

Second, to optimise draw calls you basically just reuse materials in the scene (drawcall = 1 material + 1 geometry rendered in a frame, the more distinct material+geometry combos you have the slower frame rendering becomes.) Blender workflow tends to result in the same material being copy-pasted over and over again as Material, Material.001, `Material.002. Each of these materials is exactly the same. Make sure to remove these duplicates.

After removing the duplicates, you will be able to use InstancedMeshes & BatchedMeshes to bundle meshes into bigger draw calls (ex. 20 bigger draw calls instead of 700 small ones) to get some FPS back.

1 Like

Are you using transmission in materials?

One of the render passes could be due to that.

One thing to try is to temporarily do:

scene.traverse(e=>e.isMesh&&e.material = a shared basicmateiral)

to isolate whether slowdown is due to material complexity, or sheer draw call/triangle count.

If the framerate goes way up with everytihng using a single basic material, then you know the bottleneck is the materials.

Otherwise, it’s likely drawcalls and trianglecount.

Properly merging geometries is tricky but do-able with multiple materials.
Basically you merge the geometries with draw groups…
and then on the resulting mesh, you assign an array of the materials to mesh.material = [mat0 , mat1, mat2 … ]

Thank you so much for your advice, I’ll go throw my components and hooks to see if there are unnecessary rerenders.

And for Performance trace, I did record trace.

Most of the time are taken by animation frame which by average costs around 30ms. And in which I found the renderTransmissionPass taking around half of the time. And other time taken are mostly for my mouse interaction with the models using r3f’s pointer function props: onPointerEnter, onPointerOver, onClick…
Those looks normal from my view, and I failed to see where I can modify to reduce the time for each frame.

If it is not that troublesome for you, could you please look into the trace record below for me? Thank you so much.

TemplateOrbitTrace-20251114T150102.json.zip (2.2 MB)

And for drawcalls, for the 164 models in this scene, many of them come with multiple meshes using different geometry and materials, one model even comes with 50+ geometries and 50+ materials.

According to my inspect report using gltf-tranform, there are 207 meshes with 368 geometries, 421 textures, 340 materials and 6926121 vertices. Those are models already processed with my gltf-transform script with the steps listed above. And currently I have no idea how I can modify the models to reduce the draw call.

And as mentioned earlier, since each model comes with different map and material, and never repeat themselves, I think batching and instancing might not help.

Yes, thank you so much, I did found renderTransmissionPass in my performance record for each render, which takes almost half of the render time. I’m not familiar with how threejs handles transparent objects, is there a way to reduce the transmissionPass to enhance performance while keeping the render result visually the same? Say, setting material.transparent=false and setting depthTest?

And following your advice, I used shared standardMaterial for all meshes, the fps boost from 18 to almost 60, and the draw calls cut by half and the commands dropped from 7000+ to 1377.

So I suppose the render pression is mostly from the material and textures.

In this case, how should I simplify those materials?

I’ve considered merging meshes with geometry utils’ merge, and assign original materials to the new mesh like you said. Yet, I face two issues:

  • I don’t really know how to record uv and other info of the original geometry, and use that to map to the original material in new mesh’s material array. I know there is a concept of geometry group, but don’t know how to implement in detail. May I know if there is an example for it? I failed to find one, most of the merge mesh cases are merging geometry, then share a material, not mapping original material to its original geometry in the merged geometry.
  • By doing so, I think I only reduce the geometries count, since the materials are still the same, the render pressure from materials are still there. Does this solution really help to enhance performance in my case?

Thank you so much.

There is a second param on mergeGeometries you pass true, and it creates a draw group for each material input…

So.. what you probably want to do first is group the meshes by the meshes material ids…
merge those into single geometries…

then merge those groups with useGroups=true in the mergeGeometries call…

Then you will end up with a geometry that has drawGroups for the number of geometries you merged.. and you make a mesh( theCombinedGeometry, [ list of unique materials ] );

And.. yeah.. you may still have pressure from the amount of materials… that may be harder to solve. But.. you won’t know until you do it.

Oh… and one more thing to try, to see how much its impacting you:

If the meshes in your scene are mostly static, you can disable matrixAutoUpdate on them to skip updating their matrices each frame.

So like..
rootOfYourScene.traverse( e=>e.matrixAutoUpdate=e.matrixWorldAutoUpdate=false)

Sorry I forget to reply.
Thank you for your advice, I’ll try the mesh merge approach to see whether I can reduce some rendering pressue.

And for the disabling matrixAutoUpdate approach, my meshes are indeed static for most of the time, and I think this approach should work. Yet I record performance trace before and after applying the change, it seems there is no significant call count changes for updateMatrixWorld, and time consumed by updateMatrixWorld is like 0.5 - 0.9ms before disabling auto update, and 0.3 - 0.4ms after, I don’t know whether it is the gain I should get or otherwise.