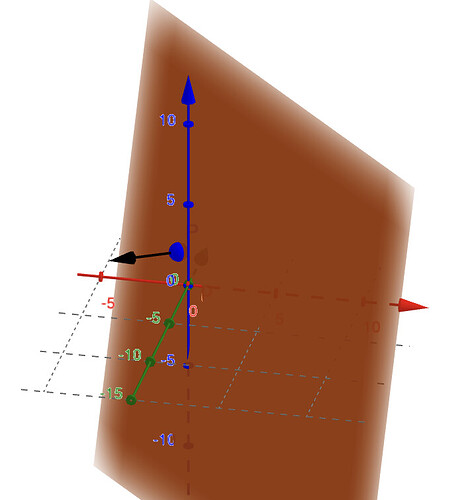
I’m building a math vizualizer similar to Geogebra. I feel like this is something people have done before. I imagine this is just done by rendering some lines in the x, y and z axis along with some cones and labels but just wanted to see if there was a better way. I’m mostly wondering how I would develop the zooming in and out interaction.
